2023 Welwyn Hatfield Borough Council election
The 2023 Welwyn Hatfield Borough Council election took place on 4 May 2023 to elect members of Welwyn Hatfield Borough Council in Hertfordshire, England.[1] This would be on the same day as other local elections across England. Out of the sixteen seats up for election, five seats changed party hands,[2] leading to the Conservative Party losing majority control of the council.
| |||||||||||||||||||||||||||||||||||||||||
16 out of 48 seats to Welwyn Hatfield Borough Council 25 seats needed for a majority | |||||||||||||||||||||||||||||||||||||||||
|---|---|---|---|---|---|---|---|---|---|---|---|---|---|---|---|---|---|---|---|---|---|---|---|---|---|---|---|---|---|---|---|---|---|---|---|---|---|---|---|---|---|
| Turnout | 26,836 | ||||||||||||||||||||||||||||||||||||||||
| |||||||||||||||||||||||||||||||||||||||||
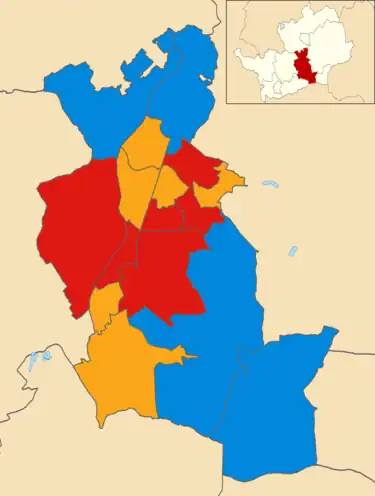 Winner of each seat at the 2023 Welwyn Hatfield Borough Council election | |||||||||||||||||||||||||||||||||||||||||
| |||||||||||||||||||||||||||||||||||||||||
Summary
Election result
| 2023 Welwyn Hatfield Borough Council election | ||||||||||
|---|---|---|---|---|---|---|---|---|---|---|
| Party | This election | Full council | This election | |||||||
| Seats | Net | Seats % | Other | Total | Total % | Votes | Votes % | +/− | ||
| Conservative | 4 | 25.0 | 18 | 22 | 45.8 | 9017 | 33.6 | -3.5 | ||
| Liberal Democrats | 6 | 37.5 | 8 | 14 | 29.2 | 6908 | 25.7 | -3.9 | ||
| Labour | 6 | 37.5 | 6 | 12 | 25.0 | 8239 | 30.7 | +0.9 | ||
| Green | 0 | 0.0 | 0.0 | 0 | 0.0 | 2365 | 8.8 | +6.2 | ||
| Reform UK | 0 | 0.0 | 0.0 | 0 | 0.0 | 162 | 0.6[lower-alpha 1] | n/a | ||
Candidates
The Statement of Persons Nominated, which details the candidates standing in each ward, was released by Welwyn Hatford Borough Council following the close of nominations on 5 April 2023.[3]
Brookmans Park and Little Heath
| Party | Candidate | Votes | % | ±% | |
|---|---|---|---|---|---|
| Conservative | Jonathan Boulton* | 1,044 | 61.6 | -3.4 | |
| Labour | Graham Beevers | 308 | 18.2 | -0.9 | |
| Liberal Democrats | Peter Basford | 204 | 12.0 | -3.9 | |
| Green | William Berrington | 128 | 7.6 | n/a | |
| Rejected ballots | 10 | 0.6 | n/a | ||
| Majority | 736 | 43.4 | -2.5 | ||
| Turnout | 1694 | 33.9 | -5 | ||
| Conservative hold | Swing | ||||
Haldens
| Party | Candidate | Votes | % | ±% | |
|---|---|---|---|---|---|
| Labour | Astrid Scott | 856 | 50.6 | +0.2 | |
| Conservative | Neil Bradbury | 521 | 30.8 | -4.5 | |
| Liberal Democrats | Jason Payne | 175 | 10.3 | -4.0 | |
| Green | Lesley Smith | 131 | 7.7 | n/a | |
| Rejected ballots | 8 | 0.5 | n/a | ||
| Majority | 335 | 19.8 | +4.7 | ||
| Turnout | 1691 | 34.5 | -1.4 | ||
| Labour gain from Conservative | Swing | ||||
Handside
| Party | Candidate | Votes | % | ±% | |
|---|---|---|---|---|---|
| Liberal Democrats | Michal Siewniak | 1,403 | 55.7 | +0.5[lower-alpha 2] | |
| Conservative | Brian Seeger | 695 | 27.6 | +0.5[lower-alpha 2] | |
| Labour | Mbizo Mpofu | 253 | 10.0 | -1.1[lower-alpha 2] | |
| Green | Philip Hopley | 154 | 6.1 | -3.8 | |
| Rejected ballots | 16 | 0.6 | n/a | ||
| Majority | 708 | 28.1 | n/a | ||
| Turnout | 2521 | 46.4 | -4.0 | ||
| Liberal Democrats hold | Swing | ||||
Hatfield Central
| Party | Candidate | Votes | % | ±% | |
|---|---|---|---|---|---|
| Labour | Kiera Thorpe | 713 | 57.2 | +4.4 | |
| Conservative | Patrick Short | 276 | 22.2 | -11.2 | |
| Liberal Democrats | Adam Edwards | 148 | 11.9 | -1.9 | |
| Green | Rody Ribeiro | 102 | 8.2 | n/a | |
| Rejected ballots | 7 | 0.6 | n/a | ||
| Majority | 437 | 35.0 | +15.6 | ||
| Turnout | 1246 | 23.1 | -3.1 | ||
| Labour hold | Swing | ||||
Hatfield East
| Party | Candidate | Votes | % | ±% | |
|---|---|---|---|---|---|
| Labour | Cathy Watson | 712 | 39.6 | -4.5 | |
| Conservative | Caron Juggins* | 592 | 32.9 | -5.5 | |
| Liberal Democrats | Muhammed Joglu | 388 | 21.6 | +11.2 | |
| Green | Ian Gregory | 99 | 5.5 | -1.6 | |
| Rejected ballots | 9 | 0.5 | n/a | ||
| Majority | 120 | 6.7 | -12.7 | ||
| Turnout | 1800 | 32.9 | 0.0 | ||
| Labour gain from Conservative | Swing | ||||
Hatfield South West
| Party | Candidate | Votes | % | ±% | |
|---|---|---|---|---|---|
| Liberal Democrats | Helena Goldwater | 659 | 43.5 | -1.9 | |
| Labour | Vaishali Shah | 559 | 36.9 | +5.3 | |
| Conservative | David Perkins | 216 | 14.3 | -5.5 | |
| Green | Antony Henn | 75 | 5.0 | n/a | |
| Rejected ballots | 5 | 0.3 | n/a | ||
| Majority | 100 | 6.6 | -7.2 | ||
| Turnout | 1514 | 27.1 | -1.6 | ||
| Liberal Democrats gain from Labour | Swing | ||||
Hatfield Villages
| Party | Candidate | Votes | % | ±% | |
|---|---|---|---|---|---|
| Labour | Rose Grewal | 707 | 43.9 | -2.3 | |
| Conservative | Phil Kurland | 476 | 29.5 | -10.7 | |
| Liberal Democrats | Brad Taylor | 289 | 17.9 | +5.0 | |
| Green | Andreas Kukol | 86 | 5.3 | n/a | |
| Reform UK | Pete Whitehead | 48 | 3 | n/a | |
| Rejected ballots | 5 | 0.3 | n/a | ||
| Majority | 231 | 14.4 | +9.1 | ||
| Turnout | 1611 | 28.2 | -1.3 | ||
| Labour gain from Conservative | Swing | ||||
Hollybush
| Party | Candidate | Votes | % | ±% | |
|---|---|---|---|---|---|
| Labour | Margaret Birleson* | 723 | 57.7 | -0.1 | |
| Conservative | Abbie Cook | 306 | 24.4 | -7.1 | |
| Liberal Democrats | Paul Wilson | 113 | 9.0 | -1.7 | |
| Green | Joseph Bristow | 98 | 7.8 | n/a | |
| Rejected ballots | 12 | 1.0 | n/a | ||
| Majority | 417 | 33.3 | +7.0 | ||
| Turnout | 1252 | 25.5 | -5.8 | ||
| Labour hold | Swing | ||||
Howlands
| Party | Candidate | Votes | % | ±% | |
|---|---|---|---|---|---|
| Labour | Jill Weston* | 861 | 54.4 | -4.1 | |
| Conservative | Ahmad Chattha | 502 | 31.7 | -2.8 | |
| Liberal Democrats | Hillary Skoczylas | 103 | 6.5 | -0.5 | |
| Green | Penelope Berrington | 102 | 6.4 | n/a | |
| Rejected ballots | 14 | 0.9 | n/a | ||
| Majority | 359 | 22.7 | -1.3 | ||
| Turnout | 1582 | 30 | -4.9 | ||
| Labour hold | Swing | ||||
Northaw and Cuffley
| Party | Candidate | Votes | % | ±% | |
|---|---|---|---|---|---|
| Conservative | George Michaelides* | 1,095 | 66.3 | -1.5 | |
| Labour | Sheila Barrett | 255 | 15.4 | -2.2 | |
| Liberal Democrats | Anthony Green | 151 | 9.1 | -5.5 | |
| Green | Brian Edwards | 139 | 8.4 | n/a | |
| Rejected ballots | 11 | 0.7 | n/a | ||
| Majority | 840 | 50.9 | +0.7 | ||
| Turnout | 1651 | 35.2 | +1.3 | ||
| Conservative hold | Swing | ||||
Panshanger
| Party | Candidate | Votes | % | ±% | |
|---|---|---|---|---|---|
| Liberal Democrats | Jane Quinton* | 728 | 47.0 | +7.7 | |
| Conservative | Liz McAuliffe | 441 | 28.5 | -5.6 | |
| Labour | Perry Hewitt | 304 | 19.6 | -7.0 | |
| Green | Cheryl Miles | 68 | 4.4 | n/a | |
| Rejected ballots | 8 | 0.5 | n/a | ||
| Majority | 287 | 18.5 | +13.3 | ||
| Turnout | 1549 | 35.2 | +0.9 | ||
| Liberal Democrats hold | Swing | ||||
Peartree
| Party | Candidate | Votes | % | ±% | |
|---|---|---|---|---|---|
| Liberal Democrats | Simon Goldwater | 582 | 44.2 | -7.6 | |
| Labour | Tom Green | 466 | 35.4 | +2.0 | |
| Conservative | Jeet Dhelaria | 167 | 12.7 | +1.1 | |
| Green | Claudia Ferlisi | 91 | 6.9 | n/a | |
| Rejected ballots | 10 | 0.8 | n/a | ||
| Majority | 116 | 8.8 | -9.6 | ||
| Turnout | 1316 | 24.3 | -3.7 | ||
| Liberal Democrats hold | Swing | ||||
Sherrards
| Party | Candidate | Votes | % | ±% | |
|---|---|---|---|---|---|
| Liberal Democrats | Frank Marsh* | 1,020 | 52.9 | -1.5 | |
| Labour | Leo Gilbert | 416 | 21.6 | +7.3 | |
| Conservative | Siva Kumar | 337 | 17.5 | -6.8 | |
| Green | David Cox | 83 | 4.3 | -0.6 | |
| Reform UK | Jack Aaron | 69 | 3.6 | n/a | |
| Rejected ballots | 3 | 0.2 | n/a | ||
| Majority | 604 | 31.3 | +1.2 | ||
| Turnout | 1928 | 44.2 | -2.5 | ||
| Liberal Democrats hold | Swing | ||||
Welham Green and Hatfield South
| Party | Candidate | Votes | % | ±% | |
|---|---|---|---|---|---|
| Liberal Democrats | Adrienne Nix | 613 | 37.9 | -7.7 | |
| Conservative | Teresa Travell | 566 | 35.0 | +1.8 | |
| Labour | Linda Mendez | 335 | 20.7 | +3.2 | |
| Green | Ian Nendick | 50 | 3.1 | n/a | |
| Reform UK | Shane Scott | 45 | 2.8 | n/a | |
| Rejected ballots | 9 | 0.6 | n/a | ||
| Majority | 57 | 2.9 | -9.5 | ||
| Turnout | 1618 | 31.2 | -0.8 | ||
| Liberal Democrats gain from Conservative | Swing | ||||
Welwyn East
| Party | Candidate | Votes | % | ±% | |
|---|---|---|---|---|---|
| Conservative | Roger Trigg* | 849 | 45.6 | -6.7 | |
| Labour | Alan Chesterman | 571 | 30.6 | +1.7 | |
| Green | Mary Barton | 235 | 12.6 | n/a | |
| Liberal Democrats | Pashang Fatemi | 204 | 10.9 | -8.2 | |
| Rejected ballots | 12 | 0.6 | n/a | ||
| Majority | 278 | 15.0 | -8.3 | ||
| Turnout | 1871 | 35.7 | -7.2 | ||
| Conservative hold | Swing | ||||
Welwyn West
| Party | Candidate | Votes | % | ±% | |
|---|---|---|---|---|---|
| Conservative | Tony Kingsbury* | 934 | 46.9 | -7.5 | |
| Green | Sarah Butcher | 724 | 36.3 | +20.2 | |
| Labour | Daniel Carlen | 200 | 10.0 | -5.3 | |
| Liberal Democrats | Simon Archer | 128 | 6.4 | -7.7 | |
| Rejected ballots | 6 | 0.6 | n/a | ||
| Majority | 210 | 10.6 | -27.6 | ||
| Turnout | 1992 | 41.3 | +2.2 | ||
| Conservative hold | Swing | ||||
Footnotes
- The missing 0.5% of total percentage consists of 145 rejected votes across the wards.
- In 2022 Handside had two seats up for election, so these parties' two candidate's average performance is used in calculating the change.
References
- "Notice of Election". Welwyn Hatfield Borough Council. 27 March 2023. Retrieved 11 April 2023.
- "RECAP: Welwyn Hatfield Borough Council election results 2023 on historic day". Welwyn Hatfield Times. 5 May 2023. Retrieved 8 May 2023.
- "Election Day - Thursday 4 May 2023". Welwyn Hatfield Borough Council. Retrieved 11 April 2023.
This article is issued from Wikipedia. The text is licensed under Creative Commons - Attribution - Sharealike. Additional terms may apply for the media files.