List of sovereign states by natural increase
This article contains a list of countries by rate of natural increase.
|
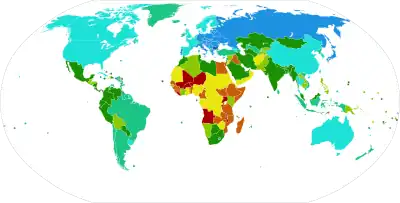
≥ 30
25 – 29.99
20 – 24.99
15 – 19.99 |
10 – 14.99
5 – 9.99
0 – 4.99
-5 – -0.01 |
< -5
Data unavailable |
Methodology
The rate of natural increase is defined as the crude birth rate minus the crude death rate. It is expressed as a rate per 1,000 population.
Countries and subnational areas
The birth rates[1] and death rates[2] in columns one and two are the CIA World Factbook estimates for the year 2022 unless otherwise noted, rounded to the nearest tenth (except for Mayotte and the Falkland Islands with 2010 and 2012 estimates respectively). The natural increase rate in column three is calculated from the rounded values of columns one and two. Rates are the average annual number of births or deaths during a year per 1,000 persons; these are also known as crude birth or death rates.
Column four is from the UN Population Division [3] and shows a projection for the average natural increase rate for the time period shown using the medium fertility variant. Blank cells in column four indicate lack of data.
| Country or subnational area | Crude birth rate | Crude death rate | Natural increase rate | Natural increase rate (2015–20)[4] |
|---|---|---|---|---|
| 47.1 | 9.9 | 37.2 | 37.9 | |
| 40.9 | 5 | 35.9 | 31.8 | |
| 41.8 | 8 | 33.8 | 32.6 | |
| 41.2 | 8 | 33.2 | 27.4 | |
| 41.1 | 8.5 | 32.6 | 32 | |
| 40.1 | 7.9 | 32.2 | 31.8 | |
| 38.76[n 1] | 7.05 | 31.71 | 25.6 | |
| 40.5 | 9.5 | 31 | 30.2 | |
| 36.6 | 6.6 | 30 | 25.6 | |
| 35.2 | 6 | 29.2 | 31.2 | |
| 36.5 | 7.5 | 29 | 25.7 | |
| 34.9 | 6.1 | 28.8 | 29.7 | |
| 33.3 | 5.1 | 28.2 | 30.4 | |
| 37.7 | 9.5 | 28.2 | 24.6 | |
| 35.5 | 7.7 | 27.8 | 26.3 | |
| 35.7 | 8.1 | 27.6 | 26 | |
| 37.5 | 10.3 | 27.2 | 29.1 | |
| 33.5 | 6.3 | 27.2 | 25.1 | |
| 31.9 | 5.3 | 26.6 | 24.8 | |
| 31.5 | 5.1 | 26.4 | 28.9 | |
| 38 | 11.6 | 26.4 | 30.9 | |
| 33.6 | 7.7 | 25.9 | 29.9 | |
| 34.2 | 8.7 | 25.5 | 26.1 | |
| 30.9 | 5.6 | 25.3 | ||
| 30.5 | 5.7 | 24.8 | 25.9 | |
| 27.7 | 2.9 | 24.8 | ||
| 33.1 | 8.8 | 24.3 | 22.8 | |
| 29 | 5.5 | 23.5 | 19.8 | |
| 31.8 | 8.4 | 23.4 | 26.3 | |
| 27.9 | 4.6 | 23.3 | 27.5 | |
| 35.5 | 12.3 | 23.2 | 26.3 | |
| 28.8 | 5.8 | 23 | 30.8 | |
| 32.2 | 9.3 | 22.9 | 21.8 | |
| 28.7 | 6 | 22.7 | 26.7 | |
| 28.6 | 6.1 | 22.5 | 22.2 | |
| 28.2 | 6.2 | 22 | 26.9 | |
| 26.4 | 5 | 21.4 | 23.4 | |
| 32.8 | 11.8 | 21 | 23 | |
| 24.4 | 3.4 | 21 | ||
| 30 | 9 | 21 | 24 | |
| 24.7 | 3.9 | 20.8 | 24.3 | |
| 28.3 | 7.6 | 20.7 | 25.7 | |
| 28.1 | 7.4 | 20.7 | 26.6 | |
| 26.4 | 5.9 | 20.5 | 26.8 | |
| 26.5 | 6 | 20.5 | 21.5 | |
| 26 | 5.7 | 20.3 | 25.1 | |
| 27 | 6.7 | 20.3 | 23.4 | |
| 22.6 | 3.5 | 19.1 | 18.2 | |
| 24.6 | 5.6 | 19 | 24.7 | |
| 22.1 | 3.2 | 18.9 | 17.2 | |
| 22.7 | 4 | 18.7 | 28.5 | |
| 22.7 | 4.2 | 18.5 | ||
| 25 | 6.9 | 18.1 | 20.6 | |
| 21.6 | 3.5 | 18.1 | 13.9 | |
| 22 | 4.3 | 17.7 | ||
| 21.6 | 4 | 17.6 | 24.5 | |
| 22.3 | 4.9 | 17.4 | 20 | |
| 21.3 | 3.9 | 17.4 | 16.8 | |
| 21.5 | 4.3 | 17.2 | 20.7 | |
| 22.5 | 6.6 | 15.9 | 24.8 | |
| 22.3 | 6.4 | 15.9 | 14.7 | |
| 17.8 | 2.3 | 15.5 | 11.7 | |
| 20.3 | 5 | 15.3 | 17.3 | |
| 22.3 | 7.1 | 15.2 | 14.6 | |
| 20.7 | 5.7 | 15 | 26.3 | |
| 21.1 | 6.3 | 14.8 | ||
| 22.7 | 8 | 14.7 | ||
| 20.9 | 6.4 | 14.5 | ||
| 18.5 | 4.3 | 14.2 | 20 | |
| 18.4 | 4.2 | 14.2 | 16.3 | |
| 21.1 | 7.2 | 13.9 | 16 | |
| 19.2 | 5.4 | 13.8 | 19.3 | |
| 23.4 | 9.7 | 13.7 | 10.8 | |
| 19.3 | 5.8 | 13.5 | 16.7 | |
| 19.5 | 6.1 | 13.4 | 18.7 | |
| 17.9 | 4.7 | 13.2 | 17.4 | |
| 20.1 | 6.9 | 13.2 | 21.7 | |
| 18.5 | 5.8 | 12.7 | ||
| 18.6 | 6 | 12.6 | 11.4 | |
| 17.4 | 5.1 | 12.3 | 15.1 | |
| 16.1 | 3.8 | 12.3 | 10.6 | |
| 17.7 | 5.5 | 12.2 | 12.8 | |
| 18.6 | 6.5 | 12.1 | 15.1 | |
| 23.2 | 11.1 | 12.1 | 12.7 | |
| 17.9 | 5.9 | 12 | 11.4 | |
| 17.5 | 5.6 | 11.9 | 13.6 | |
| 18 | 6.1 | 11.9 | 14 | |
| 18 | 6.3 | 11.7 | 13.6 | |
| 17.5 | 6 | 11.5 | 16.9 | |
| 16.3 | 4.9 | 11.4 | 15.2 | |
| 15.5 | 4.2 | 11.3 | 11.6 | |
| 16.5 | 5.2 | 11.3 | 15.8 | |
| 16.5 | 5.2 | 11.3 | 14.8 | |
| 20.3 | 9.1 | 11.2 | 19.3 | |
| 17.4 | 6.6 | 10.8 | 14 | |
| 14.2 | 3.4 | 10.8 | 15.5 | |
| 16.7 | 6.1 | 10.6 | ||
| 17.3 | 6.8 | 10.5 | 11.1 | |
| 16.6 | 6.4 | 10.2 | 13.3 | |
| 15.5 | 5.4 | 10.1 | 16 | |
| 15.3 | 5.2 | 10.1 | 14.2 | |
| 15.5 | 5.4 | 10.1 | ||
| 13.5 | 3.5 | 10 | ||
| 15.7 | 5.8 | 9.9 | 10.7 | |
| 16.7 | 6.9 | 9.8 | 12.6 | |
| 15.9 | 6.2 | 9.7 | 11.2 | |
| 12.4 | 2.8 | 9.6 | 11.8 | |
| 15.8 | 6.3 | 9.5 | 18.1 | |
| 15.2 | 5.7 | 9.5 | 9.1 | |
| 14.1 | 4.6 | 9.5 | ||
| 14.3 | 4.9 | 9.4 | 9.1 | |
| 18.6 | 9.3 | 9.3 | 11.1 | |
| 10.8 | 1.6 | 9.2 | 8.9 | |
| 16.3 | 7.1 | 9.2 | 9.5 | |
| 14.6 | 5.7 | 8.9 | 11.8 | |
| 15.4 | 6.6 | 8.8 | 11.3 | |
| 15.3 | 6.8 | 8.5 | 11.8 | |
| 15.9 | 7.4 | 8.5 | 8.7 | |
| 15.6 | 7.3 | 8.3 | 9.5 | |
| 14.6 | 6.4 | 8.2 | 11.5 | |
| 14.1 | 5.9 | 8.2 | 8.6 | |
| 14.6 | 6.4 | 8.2 | 7.3 | |
| 14.3 | 6.1 | 8.2 | 10.8 | |
| 9.3 | 1.4 | 7.9 | 8.5 | |
| 13.5 | 5.6 | 7.9 | 9.2 | |
| 13.1 | 5.6 | 7.5 | 13.3 | |
| 15.2 | 7.7 | 7.5 | 9.5 | |
| 12 | 4.6 | 7.4 | ||
| 13.8 | 6.5 | 7.3 | 9.4 | |
| 15.4 | 8.1 | 7.3 | 14.2 | |
| 14 | 6.8 | 7.2 | 7.7 | |
| 14.9 | 8.1 | 6.8 | ||
| 13.6 | 6.9 | 6.7 | 8.7 | |
| 16.8 | 10.3 | 6.5 | 11.7 | |
| 12.6 | 6.1 | 6.5 | ||
| 12.3 | 5.8 | 6.5 | ||
| 13 | 6.6 | 6.4 | 5.4 | |
| 14.9 | 8.6 | 6.3 | ||
| 12.8 | 6.5 | 6.3 | 6.3 | |
| 10.9 | 4.9 | 6 | ||
| 17.2 | 11.3 | 5.9 | 12.6 | |
| 12.8 | 6.9 | 5.9 | 5.7 | |
| 13.6 | 7.7 | 5.9 | 11.8 | |
| 13.9 | 8.1 | 5.8 | ||
| 11.7 | 6 | 5.7 | ||
| 13.9 | 8.3 | 5.6 | ||
| 12.3 | 6.7 | 5.6 | 7 | |
| 11 | 5.4 | 5.6 | ||
| 12.3 | 6.8 | 5.5 | 6.3 | |
| 12.4 | 6.9 | 5.5 | 9 | |
| 12.7 | 7.3 | 5.4 | 4 | |
| 13.9 | 8.8 | 5.1 | ||
| 9.1 | 4 | 5.1 | 4.3 | |
| 10.9 | 5.9 | 5 | ||
| 12.2 | 7.3 | 4.9 | ||
| 13.8 | 9 | 4.8 | ||
| 12.3 | 7.5 | 4.8 | ||
| 14.2 | 9.5 | 4.7 | ||
| 12.4 | 7.8 | 4.6 | ||
| 13.2 | 8.7 | 4.5 | ||
| 11.6 | 7.2 | 4.4 | 3.5 | |
| 9.1 | 4.7 | 4.4 | ||
| 12 | 8 | 4 | 3.1 | |
| 12 | 8.1 | 3.9 | 5 | |
| 12.3 | 8.4 | 3.9 | 3.3 | |
| 10.6 | 6.9 | 3.7 | 3.6 | |
| 12.7 | 9.2 | 3.5 | 4.5 | |
| 12.6 | 9.1 | 3.5 | ||
| 11.5 | 8.3 | 3.2 | ||
| 11.8 | 8.6 | 3.2 | 2.7 | |
| 10.8 | 8 | 2.8 | 3.1 | |
| 11.6 | 8.8 | 2.8 | 3.3 | |
| 10.8 | 8.4 | 2.4 | 4.8 | |
| 10.1 | 7.8 | 2.3 | 2.9 | |
| 10.3 | 8 | 2.3 | ||
| 11.7 | 9.5 | 2.2 | 2 | |
| 10.2 | 8.1 | 2.1 | 2.7 | |
| 9.9 | 7.9 | 2 | 4.8 | |
| 10.4 | 8.4 | 2 | 2.3 | |
| 11 | 9.1 | 1.9 | ||
| 11 | 9.2 | 1.8 | 1.4 | |
| 10.8 | 9.1 | 1.7 | 2.2 | |
| 11.2 | 9.5 | 1.7 | 1 | |
| 11.1 | 9.5 | 1.6 | 4.3 | |
| 10.8 | 9.5 | 1.3 | 2.7 | |
| 11 | 9.6 | 1.4 | 1.1 | |
| 9.3 | 8.1 | 1.2 | ||
| 9.7 | 8.5 | 1.2 | 1 | |
| 9.9 | 8.9 | 1 | 1.9 | |
| 11.2 | 10.3 | 0.9 | 1.1 | |
| 10.5 | 9.6 | 0.9 | 1.3 | |
| 10.1 | 9.3 | 0.8 | 1.3 | |
| 9.8 | 9.2 | 0.6 | ||
| 10.6 | 10.2 | 0.4 | ||
| 9.3 | 9 | 0.3 | ||
| 11 | 10.8 | 0.2 | 0.7 | |
| 8.9 | 8.8 | 0.1 | ||
| 10.4 | 10.4 | 0 | 0.4 | |
| 8 | 8 | 0 | 4.5 | |
| 6.9 | 7.1 | -0.2 | 1.5 | |
| 9.5 | 9.9 | -0.4 | 0.1 | |
| 7.4 | 7.9 | -0.5 | 0.9 | |
| 6.9 | 7.9 | -1 | ||
| 8.9 | 10.1 | -1.2 | 0.6 | |
| 8.4 | 10.3 | -1.9 | -2.4 | |
| 7.9 | 9.8 | -1.9 | -2 | |
| 8.3 | 10.4 | -2.1 | -0.2 | |
| 8.6 | 10.7 | -2.1 | ||
| 8.5 | 10.7 | -2.2 | -0.2 | |
| 10.2 | 12.5 | -2.3 | -1.5 | |
| 9.1 | 12 | -2.9 | -1.7 | |
| 8 | 10.9 | -2.9 | -2.8 | |
| 7.1 | 10.2 | -3.1 | -0.5 | |
| 9.1 | 12.9 | -3.8 | -0.7 | |
| 9.5 | 13.4 | -3.9 | 0.1 | |
| 6.7 | 10.7 | -4 | ||
| 8.7 | 12.9 | -4.2 | ||
| 8.7 | 12.9 | -4.2 | -3 | |
| 8.8 | 13.1 | -4.3 | -1.3 | |
| 7 | 11.3 | -4.3 | -2.8 | |
| 7.6 | 12 | -4.4 | -3 | |
| 7 | 11.6 | -4.6 | -2.9 | |
| 6.5 | 11.2 | -4.7 | ||
| 9 | 13.8 | -4.8 | -5.6 | |
| 9.3 | 15.1 | -5.8 | -3.2 | |
| 8.7 | 14.7 | -6 | -3.8 | |
| 8.1 | 14.4 | -6.3 | -6.4 | |
| 8.8 | 15.3 | -6.5 | -3.2 | |
Summary by region
The table below assembles history and projections for the major regions shown. The numbers show total births minus total deaths per 1,000 population for the region for each time period. The first four columns show actual rate of natural increase. The remaining columns show projections using the medium fertility variant. All numbers are from the UN Population Division.[4]
| Region | 1950– |
1970– |
1990– |
2010– |
2015– |
2025– |
2035– |
2045– |
|---|---|---|---|---|---|---|---|---|
| World | +17.8 | +19.5 | +15.2 | +11.9 | +10.9 | +8.7 | +7.0 | +5.6 |
| Africa | +21.5 | +27.4 | +26.1 | +26.4 | +25.3 | +22.8 | +20.6 | +18.1 |
| Asia | +19.3 | +22.8 | +16.4 | +10.7 | +9.3 | +6.3 | +3.8 | +1.8 |
| Europe | +10.3 | +5.5 | +0.3 | −0.1 | −0.7 | −2.1 | −2.8 | −3.2 |
| Latin America & The Caribbean | +27.1 | +25.8 | +19.0 | +11.9 | +10.4 | +7.5 | +4.9 | +2.8 |
| Northern America | +14.9 | +6.4 | +6.6 | +4.2 | +4.2 | +3.5 | +2.0 | +1.1 |
| Oceania | +15.7 | +14.5 | +12.2 | +10.5 | +9.7 | +8.0 | +6.4 | +5.3 |
Notes
- 2010 estimate
- 2012 estimate
References
- "The World Factbook — Central Intelligence Agency". www.cia.gov. Archived from the original on November 2, 2022.
- "The World Factbook — Central Intelligence Agency". www.cia.gov. Archived from the original on October 27, 2022.
- "World Population Prospects 2019". United Nations Department of Economic and Social Affairs.
- ""United Nations Population Div, World Population Prospects 2017, File: Rate of Natural Population Growth Rate". Archived from the original on 27 September 2016. Retrieved 23 June 2018.
See also
| Major topics | |
|---|---|
| Biology and related topics | |
| Society and population | |
| Publications | |
| Lists | |
Events and organizations |
|
| Related topics | |
| |