1964 United States presidential election in Alabama
The 1964 United States presidential election in Alabama was held on November 3, 1964. Alabama voters chose ten representatives, or electors, to the Electoral College, who voted for President and Vice-President. In Alabama, voters voted for electors individually instead of as a slate, as in the other states.
| ||||||||||||||||||||||||||
| ||||||||||||||||||||||||||
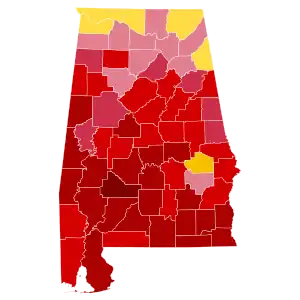 County Results
| ||||||||||||||||||||||||||
| ||||||||||||||||||||||||||


| Elections in Alabama |
|---|
 |
|
|
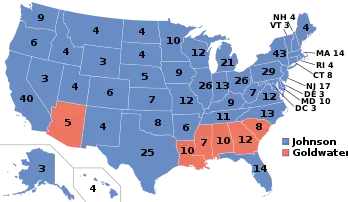
The slate of Republican electors pledged to presidential nominee Barry Goldwater of Arizona easily defeated the slate of unpledged Democratic electors. Incumbent Democratic president Lyndon B. Johnson was widely opposed by the conservative Democratic establishment in the Deep South for being too liberal on racial issues, so the local party chose to run a slate of electors who wouldn’t be obligated to support Johnson.
With his victory, Goldwater became the first Republican since 1872 to carry Alabama, as well as the first Republican to ever carry the state without winning the presidency. As of the 2020 presidential election, this is the last election in which Sumter County, Greene County, Wilcox County, Lowndes County, and Bullock County voted for the Republican candidate, as well as the last time that Macon County did not vote for the national Democratic candidate.
This was the third occasion when a Republican nominee carried Alabama, but the first outside of Reconstruction elections in 1868 and 1872, when Ulysses S. Grant carried the state. Despite Johnson's landslide victory that year, winning 61.1% of the popular vote, the highest percentage to date, he also lost to Goldwater in four other previously solidly Democratic Southern states – Louisiana, Mississippi, South Carolina and Georgia.
With 69.45% of the popular vote, Alabama would prove to be Goldwater's second-strongest state in the 1964 election, after neighboring Mississippi.[1]
Results
| Party | Pledged to | Elector | Votes | |
|---|---|---|---|---|
| Republican Party | Barry Goldwater | Tom Abernethy | 479,085 | |
| Republican Party | Barry Goldwater | Tammy Thomas | 479,071 | |
| Republican Party | Barry Goldwater | Alfred Staples | 478,925 | |
| Republican Party | Barry Goldwater | Tandy Little, Jr. | 478,540 | |
| Republican Party | Barry Goldwater | Wiley Deal | 478,398 | |
| Republican Party | Barry Goldwater | Herbert Stockham | 477,969 | |
| Republican Party | Barry Goldwater | Gordon Lawless | 477,582 | |
| Republican Party | Barry Goldwater | Smith Lanier, II | 477,339 | |
| Republican Party | Barry Goldwater | John E. Grenier | 477,272 | |
| Republican Party | Barry Goldwater | Basil Horsfield | 476,994 | |
| Democratic Party | Unpledged | Jim Allen | 210,732 | |
| Democratic Party | Unpledged | MacDonald Gallion | 209,848 | |
| Democratic Party | Unpledged | Edmund Blair | 209,062 | |
| Democratic Party | Unpledged | Albert P. Brewer | 208,059 | |
| Democratic Party | Unpledged | Pete Mathews | 207,730 | |
| Democratic Party | Unpledged | Art Hanes | 207,594 | |
| Democratic Party | Unpledged | Albert H. Evans, Jr. | 207,577 | |
| Democratic Party | Unpledged | Frank Mizell | 207,357 | |
| Democratic Party | Unpledged | Jack Giles | 207,144 | |
| Democratic Party | Unpledged | I. J. "Jud" Scott | 206,618 | |
| Total votes | 689,817 | |||
Results by county
| County | Barry Morris Goldwater Republican |
Unpledged electors Unpledged Democratic |
Margin | Total votes cast | |||
|---|---|---|---|---|---|---|---|
| # | % | # | % | # | % | ||
| Autauga | 2,969 | 85.83% | 490 | 14.17% | 2,479 | 71.67% | 3,459 |
| Baldwin | 10,870 | 81.12% | 2,530 | 18.88% | 8,340 | 62.24% | 13,400 |
| Barbour | 3,853 | 79.76% | 978 | 20.24% | 2,875 | 59.51% | 4,831 |
| Bibb | 2,623 | 83.94% | 502 | 16.06% | 2,121 | 67.87% | 3,125 |
| Blount | 4,442 | 64.67% | 2,427 | 35.33% | 2,015 | 29.33% | 6,869 |
| Bullock | 1,516 | 57.64% | 1,114 | 42.36% | 402 | 15.29% | 2,630 |
| Butler | 4,002 | 80.44% | 973 | 19.56% | 3,029 | 60.88% | 4,975 |
| Calhoun | 10,635 | 63.13% | 6,210 | 36.87% | 4,425 | 26.27% | 16,845 |
| Chambers | 4,630 | 64.42% | 2,557 | 35.58% | 2,073 | 28.84% | 7,187 |
| Cherokee | 1,893 | 49.70% | 1,916 | 50.30% | -23 | -0.60% | 3,809 |
| Chilton | 5,202 | 75.97% | 1,645 | 24.03% | 3,557 | 51.95% | 6,847 |
| Choctaw | 2,497 | 85.81% | 413 | 14.19% | 2,084 | 71.62% | 2,910 |
| Clarke | 4,460 | 82.84% | 924 | 17.16% | 3,536 | 65.68% | 5,384 |
| Clay | 2,815 | 70.13% | 1,199 | 29.87% | 1,616 | 40.26% | 4,014 |
| Cleburne | 2,156 | 76.24% | 672 | 23.76% | 1,484 | 52.48% | 2,828 |
| Coffee | 4,910 | 80.19% | 1,213 | 19.81% | 3,697 | 60.38% | 6,123 |
| Colbert | 5,267 | 48.59% | 5,573 | 51.41% | -306 | -2.82% | 10,840 |
| Conecuh | 2,782 | 81.32% | 639 | 18.68% | 2,143 | 62.64% | 3,421 |
| Coosa | 1,978 | 72.77% | 740 | 27.23% | 1,238 | 45.55% | 2,718 |
| Covington | 7,554 | 82.33% | 1,621 | 17.67% | 5,933 | 64.66% | 9,175 |
| Crenshaw | 3,008 | 78.66% | 816 | 21.34% | 2,192 | 57.32% | 3,824 |
| Cullman | 7,152 | 58.33% | 5,110 | 41.67% | 2,042 | 16.65% | 12,262 |
| Dale | 4,970 | 83.77% | 963 | 16.23% | 4,007 | 67.54% | 5,933 |
| Dallas | 5,888 | 89.12% | 719 | 10.88% | 5,169 | 78.24% | 6,607 |
| DeKalb | 6,746 | 57.69% | 4,948 | 42.31% | 1,798 | 15.38% | 11,694 |
| Elmore | 6,363 | 83.77% | 1,233 | 16.23% | 5,130 | 67.54% | 7,596 |
| Escambia | 5,623 | 74.47% | 1,928 | 25.53% | 3,695 | 48.93% | 7,551 |
| Etowah | 12,894 | 59.06% | 8,939 | 40.94% | 3,955 | 18.11% | 21,833 |
| Fayette | 3,203 | 71.34% | 1,287 | 28.66% | 1,916 | 42.67% | 4,490 |
| Franklin | 4,025 | 56.41% | 3,110 | 43.59% | 915 | 12.82% | 7,135 |
| Geneva | 4,502 | 80.74% | 1,074 | 19.26% | 3,428 | 61.48% | 5,576 |
| Greene | 1,124 | 65.69% | 587 | 34.31% | 537 | 31.39% | 1,711 |
| Hale | 1,898 | 77.60% | 548 | 22.40% | 1,350 | 55.19% | 2,446 |
| Henry | 2,896 | 83.10% | 589 | 16.90% | 2,307 | 66.20% | 3,485 |
| Houston | 10,353 | 87.93% | 1,421 | 12.07% | 8,932 | 75.86% | 11,774 |
| Jackson | 2,730 | 46.47% | 3,145 | 53.53% | -415 | -7.06% | 5,875 |
| Jefferson | 100,756 | 72.57% | 38,082 | 27.43% | 62,674 | 45.14% | 138,838 |
| Lamar | 2,734 | 72.42% | 1,041 | 27.58% | 1,693 | 44.85% | 3,775 |
| Lauderdale | 5,978 | 47.55% | 6,593 | 52.45% | -615 | -4.89% | 12,571 |
| Lawrence | 1,809 | 50.01% | 1,808 | 49.99% | 1 | 0.03% | 3,617 |
| Lee | 5,914 | 78.69% | 1,602 | 21.31% | 4,312 | 57.37% | 7,516 |
| Limestone | 2,377 | 43.99% | 3,027 | 56.01% | -650 | -12.03% | 5,404 |
| Lowndes | 1,548 | 83.32% | 310 | 16.68% | 1,238 | 66.63% | 1,858 |
| Macon | 1,858 | 38.46% | 2,973 | 61.54% | -1,115 | -23.08% | 4,831 |
| Madison | 14,279 | 51.93% | 13,217 | 48.07% | 1,062 | 3.86% | 27,496 |
| Marengo | 3,677 | 82.33% | 789 | 17.67% | 2,888 | 64.67% | 4,466 |
| Marion | 3,966 | 69.42% | 1,747 | 30.58% | 2,219 | 38.84% | 5,713 |
| Marshall | 5,712 | 56.33% | 4,428 | 43.67% | 1,284 | 12.66% | 10,140 |
| Mobile | 49,493 | 70.72% | 20,488 | 29.28% | 29,005 | 41.45% | 69,981 |
| Monroe | 3,870 | 81.37% | 886 | 18.63% | 2,984 | 62.74% | 4,756 |
| Montgomery | 23,015 | 75.47% | 7,482 | 24.53% | 15,533 | 50.93% | 30,497 |
| Morgan | 7,013 | 56.64% | 5,368 | 43.36% | 1,645 | 13.29% | 12,381 |
| Perry | 2,046 | 79.73% | 520 | 20.27% | 1,526 | 59.47% | 2,566 |
| Pickens | 3,416 | 82.08% | 746 | 17.92% | 2,670 | 64.15% | 4,162 |
| Pike | 4,373 | 84.49% | 803 | 15.51% | 3,570 | 68.97% | 5,176 |
| Randolph | 3,127 | 62.65% | 1,864 | 37.35% | 1,263 | 25.31% | 4,991 |
| Russell | 4,877 | 76.04% | 1,537 | 23.96% | 3,340 | 52.07% | 6,414 |
| St. Clair | 4,813 | 70.76% | 1,989 | 29.24% | 2,824 | 41.52% | 6,802 |
| Shelby | 6,037 | 75.65% | 1,943 | 24.35% | 4,094 | 51.30% | 7,980 |
| Sumter | 1,653 | 80.32% | 405 | 19.68% | 1,248 | 60.64% | 2,058 |
| Talladega | 8,946 | 70.67% | 3,712 | 29.33% | 5,234 | 41.35% | 12,658 |
| Tallapoosa | 5,530 | 76.14% | 1,733 | 23.86% | 3,797 | 52.28% | 7,263 |
| Tuscaloosa | 13,227 | 68.67% | 6,036 | 31.33% | 7,191 | 37.33% | 19,263 |
| Walker | 8,582 | 58.41% | 6,110 | 41.59% | 2,472 | 16.83% | 14,692 |
| Washington | 2,803 | 70.18% | 1,191 | 29.82% | 1,612 | 40.36% | 3,994 |
| Wilcox | 1,789 | 91.93% | 157 | 8.07% | 1,632 | 83.86% | 1,946 |
| Winston | 3,438 | 71.19% | 1,391 | 28.81% | 2,047 | 42.39% | 4,829 |
| Totals | 479,085 | 69.45% | 210,731 | 30.55% | 268,354 | 38.90% | 689,816 |
Analysis
The early 1960s had seen Alabama as the epicenter of the Civil Rights Movement, highlighted by numerous black church bombings by the Ku Klux Klan in "Bombingham" (the city of Birmingham),[5] Birmingham city official Eugene "Bull" Connor's use of attack dogs against protesters opposed to racial discrimination in residential land use, and first-term Governor George Wallace's "stand in the door" against the desegregation of the University of Alabama. During the primaries for selecting Democratic presidential electors, there was bitter fighting in all five Deep South states; however, Louisiana, Mississippi, Georgia and South Carolina all chose electors pledged to President Lyndon B. Johnson.[6]
However, in Alabama, the May 5, 1964, primary chose a set of unpledged Democratic electors,[6] by a margin of five-to-one,[7] while Governor George Wallace refused totally President Johnson's civil rights and desegregation legislation via the Civil Rights Act of 1964.[8] Unlike in Mississippi with the MFDP, no effort to challenge this Wallace-sponsored slate with one loyal to the national party was attempted.[9] Consequently, Johnson would become the third winning president-elect to not appear on the ballot in Alabama, following on from Abraham Lincoln in 1860 and Harry S. Truman in 1948.
Under Wallace's guidance, the Alabama Democratic Party placed this slate of unpledged Democratic electors on the ballot,[10][11] against the advice of some legal scholars,[12] but after planning to run for president himself (as he would do in 1968), decided against this in July.
Initially, it was expected that this slate – the only option for mainstream Democrats in Alabama – would be pledged to Wallace himself, but the Governor released them from pledges to vote for him if elected.[13] Once campaigning began, Wallace supported Republican nominee Barry Goldwater[14] and did nothing to support the unpledged slate against the Arizona Senator, although he did campaign for Democratic candidates for state and local offices.[15]
Popularity of Goldwater among white voters
Republican Barry Goldwater, viewed as a dangerous right-wing extremist in the older Northeastern heartland of the Republican Party,[16] was thrashed there as had been uniformly predicted before the poll, with Texas Governor John Connally saying Goldwater would win only Alabama and Mississippi.[17]
Nevertheless, his opposition to the Civil Rights Act meant Goldwater could capture the "black belt" counties[18] that were historically the basis of Alabama's limited-suffrage single-party politics, at a time when 77 percent of blacks still had not registered to vote.[19]
Goldwater did equally well in those Appalachia counties where Republicans had been competitive in presidential elections even at the height of the "Solid South".[18] Only in the North Alabama counties of Lauderdale, Colbert, Limestone, Jackson and Cherokee – hostile to Goldwater's proposal to privatize the Tennessee Valley Authority[20] – and in Macon County, home of Tuskegee University, did Goldwater not obtain a majority. Even with powerful opposition to TVA privatization, those northern counties voting against Goldwater did so by no more than twelve percent in Limestone County.[21]
References
- "1964 Presidential Election Statistics". Dave Leip's Atlas of U.S. Presidential Elections. Retrieved 2018-03-05.
- Alabama Official and Statistical Register, 1967. Montgomery, Alabama: Skinner Printing Company. pp. 540–545.
- "Election Statistics, 1920 to Present". Office of the Clerk of the United States House of Representatives. Retrieved April 7, 2021.
- "Dave Leip's Atlas of U.S. Presidential Elections – Election Results". Dave Leip's Atlas of U.S. Presidential Elections. Retrieved April 8, 2021.
- Bullock, Charles S. and Gaddie, Ronald Keith; The Triumph of Voting Rights in the South, pp. 41–42 ISBN 0806185309.
- Congressional Quarterly, Incorporated; CQ Congressional Quarterly Weekly Report, vol. 25 (1967), p. 1121.
- McDannald, Alexander Hopkins; Yearbook of the Encyclopedia Americana (1965), p. 63.
- Frederick, Jeff; Stand Up for Alabama: Governor George Wallace; pp. 96–99 ISBN 0817315748.
- Cleghorn, Reece; 'Who Speaks for Mississippi' The Reporter, August 13, 1944, pp. 31–33.
- "Alabama Expected To Choose Electors Backed by Wallace". The New York Times. 1964-05-03. ISSN 0362-4331. Retrieved 2017-12-09.
- Denton, Herbert H. (October 21, 1964). "Flowers Attacks Wallace Democrats". The Harvard Crimson. Retrieved 2017-12-09.
- "Unpledged Votes Are Held Illegal". The New York Times. 1964-06-14. ISSN 0362-4331. Retrieved 2017-12-09.
- Carlson, Jody; George C. Wallace and the Politics of Powerlessness: The Wallace Campaigns for the Presidency, 1964-76, p. 41 ISBN 1412824494.
- Grimes, Roy; 'Look Away, Look Away...', The Victoria Advocate, October 11, 1964, p. 4A.
- Cleghord, Reece; 'Aftermath in Alabama'; The Reporter, December 3, 1964, p. 34.
- Leopold, Les; The Man Who Hated Work and Loved Labour; ISBN 1933392630.
- 'At Southern Governors' Meet: Approval of Wallace Proposal Is Unlikely'; The Dispatch, October 14, 1964, p. 1.
- Havard, William C. (editor); The Changing Politics of the South; pp. 440–441 ISBN 0807100463.
- Havard (editor); The Changing Politics of the South; p. 21.
- McMahon, Kevin J.; Rankin, David M.; Beachler, Donald W. and White, John Kenneth; Winning the White House, 2008, p. 107 ISBN 0230607683.
- David Leip's Atlas of U.S. Presidential Elections; 1964 Presidential General Election Data Graphs – Alabama