1940 United States presidential election in Alabama
The 1940 United States presidential election in Alabama took place on November 5, 1940, as part of the 1940 United States presidential election. Alabama voters chose 11 representatives, or electors, to the Electoral College, who voted for president and vice president. In Alabama, voters voted for electors individually instead of as a slate, as in the other states.
| ||||||||||||||||||||||||||
| ||||||||||||||||||||||||||
 County results
| ||||||||||||||||||||||||||
| ||||||||||||||||||||||||||
| Elections in Alabama |
|---|
 |
|
|
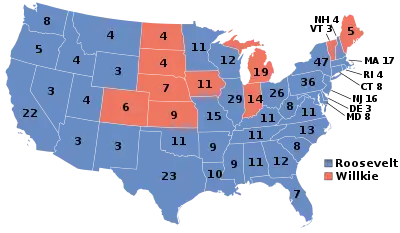
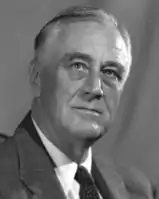
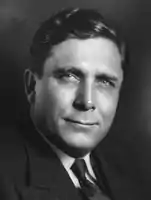
Alabama was won in a landslide by incumbent President Franklin D. Roosevelt (D–New York), running with Secretary of Agriculture Henry A. Wallace of Iowa with 85.22 percent of the popular vote, against corporate lawyer Wendell Willkie (R–New York), running with Senate Minority Leader Charles L. McNary of Oregon, with 14.34 percent of the popular vote, for a Democratic margin of 70.88 percent. Third-party candidates only managed to pick up 0.44 percent of the vote.[1]
Communist party candidate Earl Browder personally campaigned in the state giving speeches in Bullock County, Choctaw County, Clarke County, Coffee County, Conecuh County, Greene County and Hale County. Browder campaigned as an isolationist candidate advocating the United States not get involved in the war in Europe. Browder referred to the war as an "imperialist" war and he took a decidedly "anti-British tone" while campaigning in the aforementioned Alabama counties. In each of his speeches he condemned Winston Churchill and praised Joseph Stalin.[2][3] However, Browder said he was "irked by how cold" the crowds there were towards him. In the seven counties where Browder campaigned he ultimately received zero votes in the election (however, in the state as a whole he won just over 500 votes in comparison to Roosevelt's 250,726 votes and Willkie's 42,184 votes.)[2]
Results
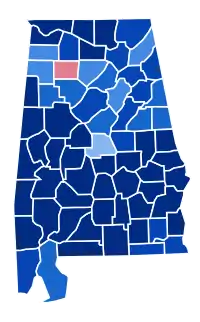
Results by county
| County | Franklin D. Roosevelt Democratic |
Wendell Lewis Willkie Republican |
Roger Ward Babson[6] Prohibition |
Earl Russell Browder[6] Communist |
Norman Mattoon Thomas[6] Socialist |
Margin | Total votes cast | ||||||
|---|---|---|---|---|---|---|---|---|---|---|---|---|---|
| # | % | # | % | # | % | # | % | # | % | # | % | ||
| Autauga | 1,630 | 93.62% | 99 | 5.69% | 10 | 0.57% | 2 | 0.11% | 0 | 0.00% | 1,531 | 87.94% | 1,741 |
| Baldwin | 2,681 | 76.58% | 617 | 17.62% | 24 | 0.72% | 12 | 0.36% | 5 | 0.15% | 2,064 | 61.85% | 3,501 |
| Barbour | 2,328 | 95.88% | 90 | 3.71% | 7 | 0.29% | 3 | 0.12% | 0 | 0.00% | 2,238 | 92.17% | 2,428 |
| Bibb | 1,821 | 90.51% | 173 | 8.60% | 9 | 0.45% | 9 | 0.45% | 0 | 0.00% | 1,647 | 81.90% | 2,012 |
| Blount | 2,784 | 75.71% | 855 | 23.25% | 32 | 0.87% | 5 | 0.14% | 1 | 0.03% | 1,929 | 52.46% | 3,677 |
| Bullock | 1,301 | 98.64% | 18 | 1.36% | 0 | 0.00% | 0 | 0.00% | 0 | 0.00% | 1,283 | 97.27% | 1,319 |
| Butler | 2,732 | 97.99% | 52 | 1.87% | 1 | 0.04% | 3 | 0.11% | 0 | 0.00% | 2,680 | 96.13% | 2,788 |
| Calhoun | 4,408 | 86.89% | 645 | 12.71% | 16 | 0.32% | 2 | 0.04% | 0 | 0.00% | 3,764 | 74.21% | 5,073 |
| Chambers | 4,141 | 97.16% | 110 | 2.58% | 10 | 0.23% | 1 | 0.02% | 0 | 0.00% | 4,031 | 94.58% | 4,262 |
| Cherokee | 2,617 | 86.94% | 381 | 12.66% | 10 | 0.33% | 1 | 0.03% | 1 | 0.03% | 2,236 | 74.29% | 3,010 |
| Chilton | 2,746 | 57.80% | 1,995 | 41.99% | 5 | 0.11% | 5 | 0.11% | 0 | 0.00% | 751 | 15.81% | 4,751 |
| Choctaw | 2,023 | 96.52% | 73 | 3.48% | 0 | 0.00% | 0 | 0.00% | 0 | 0.00% | 1,950 | 93.03% | 2,096 |
| Clarke | 3,753 | 98.71% | 48 | 1.26% | 1 | 0.03% | 0 | 0.00% | 0 | 0.00% | 3,705 | 97.45% | 3,802 |
| Clay | 2,153 | 71.22% | 854 | 28.25% | 6 | 0.20% | 10 | 0.33% | 0 | 0.00% | 1,299 | 42.97% | 3,023 |
| Cleburne | 1,369 | 75.72% | 434 | 24.00% | 4 | 0.19% | 1 | 0.05% | 0 | 0.00% | 1,205 | 57.99% | 1,808 |
| Coffee | 2,226 | 93.88% | 145 | 6.12% | 0 | 0.00% | 0 | 0.00% | 0 | 0.00% | 2,081 | 87.77% | 2,371 |
| Colbert | 3,998 | 91.47% | 365 | 8.35% | 4 | 0.09% | 1 | 0.02% | 3 | 0.07% | 3,633 | 83.12% | 4,371 |
| Conecuh | 2,345 | 97.71% | 50 | 2.08% | 5 | 0.21% | 0 | 0.00% | 0 | 0.00% | 2,295 | 95.63% | 2,400 |
| Coosa | 1,347 | 80.32% | 317 | 18.90% | 11 | 0.66% | 2 | 0.12% | 0 | 0.00% | 1,030 | 61.42% | 1,677 |
| Covington | 4,635 | 96.08% | 186 | 3.86% | 2 | 0.04% | 1 | 0.02% | 0 | 0.00% | 4,449 | 92.23% | 4,824 |
| Crenshaw | 2,680 | 96.65% | 84 | 3.03% | 7 | 0.25% | 2 | 0.07% | 0 | 0.00% | 2,596 | 93.62% | 2,773 |
| Cullman | 5,603 | 64.51% | 3,057 | 35.19% | 11 | 0.13% | 11 | 0.13% | 4 | 0.05% | 2,546 | 29.31% | 8,686 |
| Dale | 2,543 | 87.03% | 374 | 12.80% | 1 | 0.03% | 4 | 0.14% | 0 | 0.00% | 2,169 | 74.23% | 2,922 |
| Dallas | 3,106 | 95.10% | 157 | 4.81% | 2 | 0.06% | 1 | 0.03% | 0 | 0.00% | 2,949 | 90.29% | 3,266 |
| DeKalb | 5,432 | 65.77% | 2,810 | 34.02% | 13 | 0.16% | 2 | 0.02% | 2 | 0.02% | 2,622 | 31.75% | 8,259 |
| Elmore | 4,267 | 96.54% | 144 | 3.26% | 7 | 0.16% | 2 | 0.05% | 0 | 0.00% | 4,123 | 93.28% | 4,420 |
| Escambia | 2,772 | 95.03% | 137 | 4.70% | 5 | 0.17% | 3 | 0.10% | 0 | 0.00% | 2,635 | 90.33% | 2,917 |
| Etowah | 7,012 | 84.33% | 1,270 | 15.27% | 27 | 0.32% | 4 | 0.05% | 2 | 0.02% | 5,742 | 69.06% | 8,315 |
| Fayette | 2,091 | 73.42% | 737 | 25.88% | 10 | 0.35% | 10 | 0.35% | 0 | 0.00% | 1,354 | 47.54% | 2,848 |
| Franklin | 3,523 | 63.67% | 1,989 | 35.95% | 8 | 0.14% | 12 | 0.22% | 1 | 0.02% | 1,534 | 27.72% | 5,533 |
| Geneva | 2,565 | 87.19% | 364 | 12.37% | 6 | 0.20% | 7 | 0.24% | 0 | 0.00% | 2,201 | 74.81% | 2,942 |
| Greene | 894 | 92.07% | 77 | 7.93% | 0 | 0.00% | 0 | 0.00% | 0 | 0.00% | 817 | 84.14% | 971 |
| Hale | 1,691 | 98.14% | 32 | 1.86% | 0 | 0.00% | 0 | 0.00% | 0 | 0.00% | 1,659 | 96.29% | 1,723 |
| Henry | 1,960 | 96.50% | 69 | 3.40% | 2 | 0.10% | 0 | 0.00% | 0 | 0.00% | 1,891 | 93.11% | 2,031 |
| Houston | 3,941 | 88.78% | 483 | 10.88% | 13 | 0.29% | 2 | 0.05% | 0 | 0.00% | 3,458 | 77.90% | 4,439 |
| Jackson | 3,818 | 80.01% | 945 | 19.80% | 7 | 0.15% | 2 | 0.04% | 0 | 0.00% | 2,873 | 60.21% | 4,772 |
| Jefferson | 37,110 | 84.34% | 6,714 | 15.26% | 105 | 0.24% | 52 | 0.12% | 19 | 0.04% | 30,395 | 69.08% | 44,001 |
| Lamar | 2,665 | 90.28% | 275 | 9.32% | 8 | 0.27% | 4 | 0.14% | 0 | 0.00% | 2,391 | 80.97% | 2,952 |
| Lauderdale | 5,065 | 90.35% | 507 | 9.04% | 19 | 0.34% | 10 | 0.18% | 4 | 0.07% | 4,558 | 81.32% | 5,606 |
| Lawrence | 2,277 | 82.23% | 480 | 17.33% | 2 | 0.07% | 10 | 0.36% | 0 | 0.00% | 1,797 | 64.90% | 2,769 |
| Lee | 2,566 | 95.96% | 103 | 3.85% | 4 | 0.15% | 1 | 0.04% | 0 | 0.00% | 2,463 | 92.11% | 2,674 |
| Limestone | 2,941 | 96.58% | 95 | 3.12% | 9 | 0.30% | 0 | 0.00% | 0 | 0.00% | 2,846 | 93.46% | 3,045 |
| Lowndes | 1,132 | 98.86% | 12 | 1.05% | 1 | 0.09% | 0 | 0.00% | 0 | 0.00% | 1,120 | 97.82% | 1,145 |
| Macon | 1,259 | 96.77% | 41 | 3.15% | 1 | 0.08% | 0 | 0.00% | 0 | 0.00% | 1,218 | 93.62% | 1,301 |
| Madison | 5,515 | 90.44% | 566 | 9.28% | 9 | 0.15% | 3 | 0.05% | 5 | 0.08% | 4,959 | 81.46% | 6,098 |
| Marengo | 2,284 | 96.94% | 70 | 2.97% | 2 | 0.08% | 0 | 0.00% | 0 | 0.00% | 2,214 | 93.97% | 2,356 |
| Marion | 2,654 | 69.64% | 1,081 | 28.37% | 12 | 0.31% | 64 | 1.68% | 0 | 0.00% | 1,573 | 41.28% | 3,811 |
| Marshall | 4,142 | 81.55% | 913 | 17.98% | 18 | 0.35% | 4 | 0.08% | 2 | 0.04% | 3,229 | 63.58% | 5,079 |
| Mobile | 11,480 | 85.08% | 1,887 | 13.99% | 89 | 0.66% | 14 | 0.10% | 14 | 0.10% | 9,592 | 71.20% | 13,493 |
| Monroe | 2,953 | 98.17% | 40 | 1.33% | 12 | 0.40% | 3 | 0.10% | 0 | 0.00% | 2,913 | 96.84% | 3,008 |
| Montgomery | 11,311 | 97.74% | 230 | 1.99% | 16 | 0.14% | 16 | 0.14% | 0 | 0.00% | 11,081 | 95.75% | 11,573 |
| Morgan | 5,345 | 90.93% | 500 | 8.51% | 22 | 0.37% | 8 | 0.14% | 1 | 0.02% | 4,846 | 82.46% | 5,878 |
| Perry | 1,509 | 97.17% | 39 | 2.51% | 5 | 0.32% | 0 | 0.00% | 0 | 0.00% | 1,470 | 94.66% | 1,553 |
| Pickens | 1,714 | 92.00% | 140 | 7.51% | 7 | 0.45% | 2 | 0.13% | 0 | 0.00% | 1,277 | 81.55% | 1,863 |
| Pike | 3,049 | 95.94% | 121 | 3.81% | 1 | 0.03% | 7 | 0.22% | 0 | 0.00% | 2,928 | 92.13% | 3,178 |
| Randolph | 2,407 | 77.92% | 670 | 21.69% | 8 | 0.26% | 4 | 0.13% | 0 | 0.00% | 1,737 | 56.23% | 3,089 |
| Russell | 2,435 | 97.95% | 48 | 1.93% | 2 | 0.08% | 1 | 0.04% | 0 | 0.00% | 2,387 | 96.02% | 2,486 |
| Shelby | 2,777 | 74.61% | 938 | 25.20% | 5 | 0.13% | 2 | 0.05% | 0 | 0.00% | 1,839 | 49.41% | 4,024 |
| St. Clair | 2,462 | 61.18% | 1,540 | 38.27% | 9 | 0.22% | 6 | 0.15% | 7 | 0.17% | 922 | 22.91% | 3,722 |
| Sumter | 1,404 | 96.76% | 46 | 3.17% | 1 | 0.07% | 0 | 0.00% | 0 | 0.00% | 1,358 | 93.59% | 1,451 |
| Talladega | 3,965 | 87.88% | 534 | 11.84% | 9 | 0.20% | 4 | 0.09% | 0 | 0.00% | 3,431 | 76.04% | 4,512 |
| Tallapoosa | 4,325 | 96.65% | 139 | 3.11% | 7 | 0.16% | 3 | 0.07% | 1 | 0.02% | 4,186 | 93.54% | 4,475 |
| Tuscaloosa | 6,284 | 93.35% | 426 | 6.33% | 14 | 0.21% | 5 | 0.07% | 3 | 0.04% | 5,858 | 87.02% | 6,732 |
| Walker | 5,940 | 74.52% | 2,007 | 25.18% | 17 | 0.21% | 4 | 0.05% | 3 | 0.04% | 3,933 | 49.34% | 7,971 |
| Washington | 1,892 | 95.65% | 80 | 4.04% | 5 | 0.25% | 1 | 0.05% | 0 | 0.00% | 1,812 | 91.61% | 1,978 |
| Wilcox | 1,534 | 98.71% | 20 | 1.29% | 0 | 0.00% | 0 | 0.00% | 0 | 0.00% | 1,514 | 97.43% | 1,554 |
| Winston | 1,394 | 45.10% | 1,686 | 54.55% | 6 | 0.19% | 4 | 0.13% | 0 | 0.00% | -301 | -9.78% | 3,091 |
| Totals | 250,726 | 85.22% | 42,184 | 14.34% | 700 | 0.24% | 509 | 0.17% | 100 | 0.03% | 208,542 | 70.88% | 294,219 |
References
- "1940 Presidential General Election Results — Alabama". Dave Leip’s U.S. Election Atlas.
- Isserman, Maurice (1982). Which Side Were You On?: The American Communist Party During the Second World War. University of Illinois Press. p. 48. ISBN 9780252063367.
- The Southern Historian. United States: Alabama Media Planning Board and the Beta Omicron Chapter of Phi Alpha Theta, 1997.
- Alabama Official and Statistical Register, 1943. Wetumpka, Alabama: Wetumpka Printing Co. pp. 671–684.
- Scammon, Richard M. (compiler); America at the Polls: A Handbook of Presidential Election Statistics 1920-1964; pp. 29–30 ISBN 0405077114.
- "AL US President Race, November 05, 1940". Our Campaigns.