1964 United States presidential election in Maryland
The 1964 United States presidential election in Maryland took place on November 3, 1964, as part of the 1964 United States presidential election. State voters chose 10[2] representatives, or electors, to the Electoral College, who voted for president and vice president.
| ||||||||||||||||||||||||||
| ||||||||||||||||||||||||||
 County Results
| ||||||||||||||||||||||||||
| ||||||||||||||||||||||||||

| Elections in Maryland |
|---|
.svg.png.webp) |
|
|
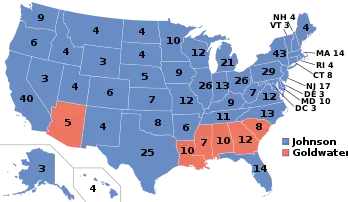
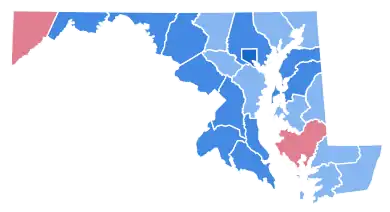
Maryland was won by incumbent President Lyndon B. Johnson (D–Texas), with 65.47% of the popular vote, against Senator Barry Goldwater (R–Arizona), with 34.53% of the popular vote.[3][4] As of the 2020 presidential election, this is the last election in which Harford County, Carroll County, Washington County, Wicomico County, Worcester County, Queen Anne's County and Caroline County voted for a Democratic Presidential candidate.[5] This is the only election since 1932 in which Carroll County voted Democratic and the only one since 1936 that Harford County did so.
However, Dorchester County on the Eastern Shore flipped against the trend from Kennedy to Goldwater, reflecting the racial tension in the area at this time and the declaration of martial law in the county by Governor J. Millard Tawes in response; similarly, it would be the only county in the state where George Wallace (who had given a speech there during the 1964 primary campaign) finished in second place four years later, ahead of Democratic Vice President Hubert Humphrey.[6] The backlash to civil rights in Dorchester County was strong enough for it to be the most Republican county in the state, ahead of even ancestrally German Unionist Garrett County (the only other county in the state that Goldwater won).
Anne Arundel County would not vote Democratic again until 2016, while Frederick and Talbot counties would not do so until 2020, with Donald Trump being the first Republican to lose all three of these counties, as well as the statewide white vote, since this election.[5] This is the last time a Democrat would win a majority of the state’s counties in a presidential election. This also marks the only election in which the Democratic candidate was able to win all of the counties that make up the Washington metropolitan area.[7] In this election, Maryland voted 8.36% to the left of the nation at-large.[8]
Results
| 1964 United States presidential election in Maryland[3] | ||||||
|---|---|---|---|---|---|---|
| Party | Candidate | Running mate | Votes | Percentage | Electoral votes | |
| Democratic | Lyndon B. Johnson | Hubert Humphrey | 730,912 | 65.47% | 10 | |
| Republican | Barry Goldwater | William E. Miller | 385,495 | 34.53% | 0 | |
Results by county
| County | Lyndon Baines Johnson Democratic |
Barry Morris Goldwater Republican |
Margin | Total votes cast[9] | |||
|---|---|---|---|---|---|---|---|
| # | % | # | % | # | % | ||
| Allegany | 20,425 | 62.25% | 12,384 | 37.75% | 8,041 | 24.51% | 32,809 |
| Anne Arundel | 37,981 | 58.70% | 26,725 | 41.30% | 11,256 | 17.40% | 64,706 |
| Baltimore | 117,153 | 60.07% | 77,870 | 39.93% | 39,283 | 20.14% | 195,023 |
| Baltimore City | 240,716 | 75.98% | 76,089 | 24.02% | 164,627 | 51.96% | 316,805 |
| Calvert | 3,335 | 65.39% | 1,765 | 34.61% | 1,570 | 30.78% | 5,100 |
| Caroline | 3,710 | 57.91% | 2,696 | 42.09% | 1,014 | 15.83% | 6,406 |
| Carroll | 8,451 | 50.35% | 8,332 | 49.65% | 119 | 0.71% | 16,783 |
| Cecil | 7,854 | 59.57% | 5,330 | 40.43% | 2,524 | 19.14% | 13,184 |
| Charles | 6,546 | 65.45% | 3,455 | 34.55% | 3,091 | 30.91% | 10,001 |
| Dorchester | 4,564 | 46.14% | 5,327 | 53.86% | -763 | -7.71% | 9,891 |
| Frederick | 14,548 | 61.10% | 9,264 | 38.90% | 5,284 | 22.19% | 23,812 |
| Garrett | 3,515 | 49.24% | 3,624 | 50.76% | -109 | -1.53% | 7,139 |
| Harford | 13,550 | 57.62% | 9,968 | 42.38% | 3,582 | 15.23% | 23,518 |
| Howard | 8,185 | 54.50% | 6,833 | 45.50% | 1,352 | 9.00% | 15,018 |
| Kent | 4,113 | 67.19% | 2,008 | 32.81% | 2,105 | 34.39% | 6,121 |
| Montgomery | 103,113 | 66.24% | 52,554 | 33.76% | 50,559 | 32.48% | 155,667 |
| Prince George's | 81,806 | 63.80% | 46,413 | 36.20% | 35,393 | 27.60% | 128,219 |
| Queen Anne's | 4,052 | 67.45% | 1,955 | 32.55% | 2,097 | 34.91% | 6,007 |
| Somerset | 4,527 | 58.93% | 3,155 | 41.07% | 1,372 | 17.86% | 7,682 |
| St. Mary's | 5,831 | 66.95% | 2,878 | 33.05% | 2,953 | 33.91% | 8,709 |
| Talbot | 4,671 | 55.85% | 3,693 | 44.15% | 978 | 11.69% | 8,364 |
| Washington | 19,858 | 60.89% | 12,756 | 39.11% | 7,102 | 21.78% | 32,614 |
| Wicomico | 8,695 | 53.86% | 7,448 | 46.14% | 1,247 | 7.72% | 16,143 |
| Worcester | 3,713 | 55.53% | 2,973 | 44.47% | 740 | 11.07% | 6,686 |
| Totals | 730,912 | 65.47% | 385,495 | 34.53% | 345,417 | 30.94% | 1,116,407 |
Counties that flipped from Republican to Democratic
Counties that flipped from Democratic to Republican
See also
References
- "United States Presidential election of 1964 - Encyclopædia Britannica". Retrieved May 30, 2017.
- "1964 Election for the Forty-Fifth Term (1965-69)". Retrieved May 30, 2017.
- Maryland Manual 1965–1966. The Hall of Records Commission of the State of Maryland. p. 477. Retrieved May 12, 2019.
- "The American Presidency Project - Election of 1964". Retrieved May 30, 2017.
- Sullivan, Robert David; ‘How the Red and Blue Map Evolved Over the Past Century’; America Magazine in The National Catholic Review; June 29, 2016
- School Desegregation in Dorchester County, Maryland (PDF). United States Commission on Civil Rights. September 1977.
- "Maryland". Google Docs. Retrieved October 4, 2022.
- "Dave Leip's Atlas of U.S. Presidential Elections". uselectionatlas.org. Retrieved March 31, 2023.
- Scammon, Richard M. (compiler); America at the Polls: A Handbook of Presidential Election Statistics 1920-1964; p. 211 ISBN 0405077114