2008 United States presidential election in Tennessee
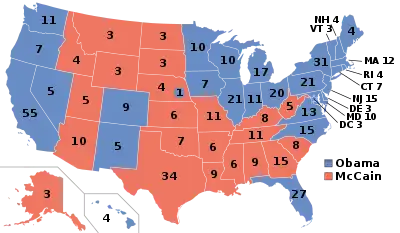
The 2008 United States presidential election in Tennessee took place on November 4, 2008, and was part of the 2008 United States presidential election. Voters chose 11 representatives, or electors to the Electoral College, who voted for president and vice president.
| ||||||||||||||||||||||||||
| Turnout | 66.34% | |||||||||||||||||||||||||
|---|---|---|---|---|---|---|---|---|---|---|---|---|---|---|---|---|---|---|---|---|---|---|---|---|---|---|
| ||||||||||||||||||||||||||
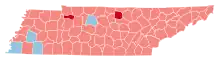
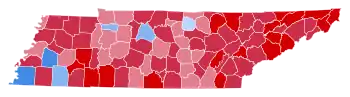 County Results
| ||||||||||||||||||||||||||
| ||||||||||||||||||||||||||
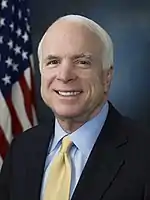
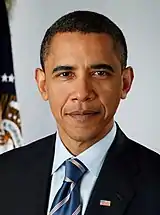
Republican John McCain defeated Democrat Barack Obama in the state by 15 percentage points. Prior to the election, 17 news organizations had correctly predicted that McCain would easily carry the state, and virtually all polling indicated the same. Most news organizations called Tennessee for McCain immediately after the polls closed. McCain slightly improved upon George W. Bush's performance in 2004, despite the nation as a whole trending significantly Democratic in 2008. This was the first time since 1960 that Tennessee did not back the overall winning candidate in a presidential election.
As of 2020, this remains the last time that Houston County and Jackson County have voted for a Democratic presidential nominee or that the party has received more than 40% of the vote. It was one of five states to swing Republican from 2004, along with West Virginia, Louisiana, Oklahoma, and Arkansas.
Campaign
Predictions
| Elections in Tennessee |
|---|
 |
|
|
There were 16 news organizations who made state-by-state predictions of the election. Here are their last predictions before election day:
| Source | Ranking |
|---|---|
| D.C. Political Report[2] | Likely R |
| Cook Political Report[3] | Solid R |
| The Takeaway[4] | Solid R |
| Electoral-vote.com[5] | Solid R |
| Washington Post[6] | Solid R |
| Politico[7] | Solid R |
| RealClearPolitics[8] | Solid R |
| FiveThirtyEight[6] | Solid R |
| CQ Politics[9] | Solid R |
| The New York Times[10] | Solid R |
| CNN[11] | Safe R |
| NPR[6] | Solid R |
| MSNBC[6] | Solid R |
| Fox News[12] | Likely R |
| Associated Press[13] | Likely R |
| Rasmussen Reports[14] | Safe R |
Polling
McCain won every single pre-election poll, and each by a double-digit margin of victory. The final 3 polls averaged McCain leading 55% to 40%.[15]
Fundraising
John McCain raised a total of $2,941,065 in the state. Barack Obama raised $3,481,341.[16]
Advertising and visits
Obama spent $518,659. The Republican ticket spent just $3,526.[17] Obama visited the state once, going to Nashville. McCain visited the state twice, visiting Nashville and Blountville.[18]
Analysis
Despite narrowly voting for Bill Clinton in 1992 and 1996 when former Tennessee Senator Al Gore was on the ticket as Vice President, the state, along with neighboring Arkansas has steadily been trending Republican since then. George W. Bush narrowly carried the state in 2000 over Gore and easily won in 2004 over John Kerry.
A handful of Tennessean counties—including those that hadn't voted Republican since landslide victors Reagan or Nixon were on the ballot, swung dramatically Republican. For example, Grundy County, in southeastern Tennessee, broke 56%-42% for John Kerry in 2004, but wound up being swept by McCain 55%-42% this year. The state was one of five states that swung even more Republican in 2008 with John McCain soundly defeating Barack Obama in the Volunteer State. 2008 marked the first time since 1960 whereby the state was carried by the losing presidential candidate. A possible factor to Tennessee ironically swinging rightward—despite the national Democratic trend—could be the state favoring Hillary Clinton, former First Lady of neighboring Arkansas, over Barack Obama in the Democratic primary, as was the case in Arkansas itself.
McCain won both East Tennessee and Middle Tennessee by landslide margins. Historically, East Tennessee, which is a part of Appalachia, is one of the few ancestrally Republican areas of the South. Most of its residents strongly opposed secession during the Civil War. They identified with the GOP after the return of peace and have remained in the Republican fold through good times and bad ever since. Some of the region's counties are among the few in the country to have never supported a Democrat for president.
However, Middle Tennessee has Democratic roots based on liberal economic policies, most famously Franklin D. Roosevelt's Tennessee Valley Authority. Middle Tennessee voted strongly for Bill Clinton of neighboring Arkansas, but Middle Tennessee native Al Gore narrowly lost the region in 2000—a loss that ultimately cost him Tennessee, and the election. In contrast, it was one of the few regions in the country which voted more Republican than in 2004.[19] This is largely due to a growing social conservative trend in the region, particularly in the Nashville suburbs; some of the most politically active churches in the state are located there.
On the other hand, Barack Obama did improve relatively well upon John Kerry's performances in the traditionally Democratic cities of Nashville and Memphis. In the former, support amongst progressive whites led to a 3-2 victory for Obama in Davidson County.[19] In Memphis, heavy African American turnout ensured him the largest margin in the state in Shelby County, although far from enough to outweigh his losses everywhere else in the state. McCain, however, carried the third- and fourth- most populated cities of Chattanooga in Hamilton County as well as Knoxville in Knox County.
During the same election, at the state level, Republicans picked up four seats in the Tennessee House of Representatives and three seats in the Tennessee Senate to obtain control of both chambers of the state legislature for the first time since Reconstruction.
Results
| United States presidential election in Tennessee, 2008[20] | ||||||
|---|---|---|---|---|---|---|
| Party | Candidate | Running mate | Votes | Percentage | Electoral votes | |
| Republican | John McCain | Sarah Palin | 1,479,178 | 56.85% | 11 | |
| Democratic | Barack Obama | Joe Biden | 1,087,437 | 41.79% | 0 | |
| Independent | Ralph Nader | Matt Gonzalez | 11,560 | 0.44% | 0 | |
| Libertarian | Bob Barr | Wayne Allyn Root | 8,547 | 0.33% | 0 | |
| Constitution | Chuck Baldwin | Darrell Castle | 8,191 | 0.31% | 0 | |
| Green | Cynthia McKinney | Rosa Clemente | 2,499 | 0.10% | 0 | |
| Write-ins | Write-ins | Write-ins | 2,333 | 0.09% | 0 | |
| Socialist | Brian Moore | Stewart Alexander | 1,326 | 0.05% | 0 | |
| Boston Tea | Charles Jay | Thomas Knapp | 1,011 | 0.04% | 0 | |
| Totals | 2,601,982 | 100.00% | 11 | |||
| Voter turnout (Voting age population) | 55.5% | |||||
By county
| County | John McCain Republican | Barack Obama Democratic | Other votes | Total votes | |||
|---|---|---|---|---|---|---|---|
| % | # | % | # | % | # | ||
| Anderson | 62.32% | 19,675 | 36.10% | 11,396 | 1.58% | 499 | 31,570 |
| Bedford | 65.89% | 10,217 | 32.42% | 5,027 | 1.70% | 263 | 15,507 |
| Benton | 57.05% | 3,696 | 40.82% | 2,645 | 2.13% | 138 | 6,479 |
| Bledsoe | 66.18% | 3,166 | 31.71% | 1,517 | 2.11% | 101 | 4,784 |
| Blount | 68.88% | 35,571 | 29.53% | 15,253 | 1.59% | 821 | 51,645 |
| Bradley | 74.19% | 28,333 | 24.50% | 9,357 | 1.31% | 501 | 38,191 |
| Campbell | 67.59% | 8,535 | 30.62% | 3,867 | 1.79% | 226 | 12,628 |
| Cannon | 60.88% | 3,322 | 36.85% | 2,011 | 2.27% | 124 | 5,457 |
| Carroll | 64.01% | 7,455 | 34.17% | 3,980 | 1.81% | 211 | 11,646 |
| Carter | 72.82% | 15,852 | 25.66% | 5,587 | 1.52% | 330 | 21,769 |
| Cheatham | 65.14% | 10,702 | 33.47% | 5,498 | 1.39% | 228 | 16,428 |
| Chester | 71.02% | 4,587 | 27.82% | 1,797 | 1.16% | 75 | 6,459 |
| Claiborne | 68.86% | 7,175 | 29.54% | 3,078 | 1.60% | 167 | 10,420 |
| Clay | 55.98% | 1,676 | 41.68% | 1,248 | 2.34% | 70 | 2,994 |
| Cocke | 71.67% | 8,945 | 26.76% | 3,340 | 1.57% | 196 | 12,481 |
| Coffee | 63.73% | 13,250 | 34.30% | 7,132 | 1.96% | 408 | 20,790 |
| Crockett | 66.16% | 3,994 | 32.58% | 1,967 | 1.26% | 76 | 6,037 |
| Cumberland | 67.81% | 17,436 | 30.68% | 7,889 | 1.51% | 387 | 25,712 |
| Davidson | 38.91% | 102,915 | 59.90% | 158,423 | 1.19% | 3,148 | 264,486 |
| Decatur | 65.11% | 3,101 | 32.88% | 1,566 | 2.02% | 96 | 4,763 |
| DeKalb | 57.82% | 4,085 | 40.08% | 2,832 | 2.09% | 148 | 7,065 |
| Dickson | 59.82% | 11,677 | 38.45% | 7,506 | 1.72% | 336 | 19,519 |
| Dyer | 68.23% | 9,859 | 30.53% | 4,411 | 1.25% | 180 | 14,450 |
| Fayette | 63.22% | 12,173 | 35.80% | 6,892 | 0.98% | 189 | 19,254 |
| Fentress | 71.06% | 4,789 | 27.17% | 1,831 | 1.77% | 119 | 6,739 |
| Franklin | 60.46% | 10,539 | 37.94% | 6,613 | 1.61% | 280 | 17,432 |
| Gibson | 63.60% | 13,516 | 34.85% | 7,406 | 1.56% | 331 | 21,253 |
| Giles | 59.05% | 6,902 | 39.47% | 4,614 | 1.48% | 173 | 11,689 |
| Grainger | 70.60% | 5,297 | 27.54% | 2,066 | 1.87% | 140 | 7,503 |
| Greene | 69.52% | 17,151 | 28.82% | 7,110 | 1.66% | 409 | 24,670 |
| Grundy | 55.33% | 2,563 | 42.55% | 1,971 | 2.12% | 98 | 4,632 |
| Hamblen | 68.41% | 15,508 | 30.03% | 6,807 | 1.56% | 354 | 22,669 |
| Hamilton | 55.38% | 81,702 | 43.55% | 64,246 | 1.07% | 1,572 | 147,520 |
| Hancock | 70.86% | 1,588 | 26.95% | 604 | 2.19% | 49 | 2,241 |
| Hardeman | 46.50% | 5,225 | 52.67% | 5,919 | 0.83% | 93 | 11,237 |
| Hardin | 70.52% | 7,077 | 27.84% | 2,794 | 1.63% | 164 | 10,035 |
| Hawkins | 70.13% | 14,756 | 28.18% | 5,930 | 1.68% | 354 | 21,040 |
| Haywood | 38.97% | 3,165 | 60.25% | 4,893 | 0.78% | 63 | 8,121 |
| Henderson | 70.79% | 7,669 | 27.88% | 3,021 | 1.33% | 144 | 10,834 |
| Henry | 60.41% | 8,182 | 38.04% | 5,153 | 1.55% | 210 | 13,545 |
| Hickman | 56.30% | 4,784 | 41.93% | 3,563 | 1.78% | 151 | 8,498 |
| Houston | 47.94% | 1,608 | 50.03% | 1,678 | 2.03% | 68 | 3,354 |
| Humphreys | 50.37% | 3,818 | 47.49% | 3,600 | 2.14% | 162 | 7,580 |
| Jackson | 48.54% | 2,185 | 49.41% | 2,224 | 2.04% | 92 | 4,501 |
| Jefferson | 70.65% | 13,092 | 27.94% | 5,178 | 1.41% | 262 | 18,532 |
| Johnson | 70.11% | 4,621 | 27.87% | 1,837 | 2.02% | 133 | 6,591 |
| Knox | 60.73% | 113,015 | 37.73% | 70,215 | 1.53% | 2,856 | 186,086 |
| Lake | 52.50% | 1,175 | 45.76% | 1,024 | 1.74% | 39 | 2,238 |
| Lauderdale | 52.83% | 4,933 | 46.28% | 4,322 | 0.89% | 83 | 9,338 |
| Lawrence | 65.96% | 10,566 | 32.22% | 5,161 | 1.83% | 293 | 16,020 |
| Lewis | 61.05% | 2,951 | 37.32% | 1,804 | 1.63% | 79 | 4,834 |
| Lincoln | 70.30% | 9,231 | 28.14% | 3,695 | 1.55% | 204 | 13,130 |
| Loudon | 71.29% | 15,815 | 27.31% | 6,058 | 1.40% | 311 | 22,184 |
| Macon | 69.90% | 5,145 | 27.99% | 2,060 | 2.11% | 155 | 7,360 |
| Madison | 53.12% | 23,290 | 46.09% | 20,209 | 0.79% | 347 | 43,846 |
| Marion | 58.98% | 6,746 | 39.40% | 4,506 | 1.62% | 185 | 11,437 |
| Marshall | 59.84% | 6,755 | 38.27% | 4,320 | 1.90% | 214 | 11,289 |
| Maury | 60.08% | 20,288 | 38.67% | 13,058 | 1.25% | 421 | 33,767 |
| McMinn | 69.13% | 12,984 | 29.49% | 5,539 | 1.38% | 259 | 18,782 |
| McNairy | 68.46% | 7,134 | 30.05% | 3,131 | 1.50% | 156 | 10,421 |
| Meigs | 66.01% | 2,797 | 32.38% | 1,372 | 1.60% | 68 | 4,237 |
| Monroe | 68.45% | 11,484 | 30.12% | 5,053 | 1.43% | 240 | 16,777 |
| Montgomery | 53.39% | 30,175 | 45.50% | 25,716 | 1.11% | 627 | 56,518 |
| Moore | 68.09% | 2,010 | 29.84% | 881 | 2.07% | 61 | 2,952 |
| Morgan | 69.14% | 4,717 | 28.86% | 1,969 | 1.99% | 136 | 6,822 |
| Obion | 66.26% | 8,873 | 32.17% | 4,308 | 1.58% | 211 | 13,392 |
| Overton | 55.57% | 4,497 | 42.25% | 3,419 | 2.17% | 176 | 8,092 |
| Perry | 53.20% | 1,596 | 44.30% | 1,329 | 2.50% | 75 | 3,000 |
| Pickett | 66.87% | 1,786 | 31.97% | 854 | 1.16% | 31 | 2,671 |
| Polk | 65.64% | 4,267 | 32.67% | 2,124 | 1.69% | 110 | 6,501 |
| Putnam | 62.60% | 17,101 | 35.65% | 9,739 | 1.74% | 476 | 27,316 |
| Rhea | 72.41% | 8,042 | 26.18% | 2,907 | 1.41% | 157 | 11,106 |
| Roane | 67.27% | 15,658 | 31.04% | 7,224 | 1.69% | 394 | 23,276 |
| Robertson | 64.83% | 17,903 | 33.74% | 9,318 | 1.42% | 393 | 27,614 |
| Rutherford | 58.87% | 59,892 | 39.77% | 40,460 | 1.36% | 1,385 | 101,737 |
| Scott | 72.70% | 4,931 | 25.36% | 1,720 | 1.95% | 132 | 6,783 |
| Sequatchie | 66.40% | 3,610 | 31.58% | 1,717 | 2.02% | 110 | 5,437 |
| Sevier | 73.43% | 24,922 | 25.35% | 8,604 | 1.22% | 415 | 33,941 |
| Shelby | 35.99% | 145,458 | 63.41% | 256,297 | 0.60% | 2,425 | 404,180 |
| Smith | 58.95% | 4,563 | 38.65% | 2,992 | 2.40% | 186 | 7,741 |
| Stewart | 53.68% | 2,956 | 44.85% | 2,470 | 1.47% | 81 | 5,507 |
| Sullivan | 70.02% | 44,808 | 28.68% | 18,354 | 1.30% | 835 | 63,997 |
| Sumner | 66.86% | 44,949 | 31.96% | 21,487 | 1.18% | 792 | 67,228 |
| Tipton | 67.80% | 17,165 | 31.33% | 7,931 | 0.87% | 220 | 25,316 |
| Trousdale | 52.11% | 1,688 | 45.54% | 1,475 | 2.35% | 76 | 3,239 |
| Unicoi | 69.38% | 5,011 | 29.17% | 2,107 | 1.45% | 105 | 7,223 |
| Union | 69.81% | 4,467 | 28.58% | 1,829 | 1.61% | 103 | 6,399 |
| Van Buren | 58.66% | 1,294 | 38.49% | 849 | 2.86% | 63 | 2,206 |
| Warren | 59.46% | 8,562 | 38.30% | 5,515 | 2.24% | 323 | 14,400 |
| Washington | 66.03% | 32,341 | 32.54% | 15,941 | 1.43% | 700 | 48,982 |
| Wayne | 73.75% | 4,076 | 24.52% | 1,355 | 1.74% | 96 | 5,527 |
| Weakley | 64.68% | 8,855 | 33.57% | 4,596 | 1.75% | 239 | 13,690 |
| White | 63.26% | 6,103 | 34.95% | 3,372 | 1.78% | 172 | 9,647 |
| Williamson | 69.26% | 64,858 | 29.78% | 27,886 | 0.96% | 902 | 93,646 |
| Wilson | 67.62% | 34,595 | 31.05% | 15,886 | 1.33% | 678 | 51,159 |
|
Democratic
Hold |
Republican
Hold
Gain from Democratic
|
Counties that flipped from Democratic to Republican
- Benton (largest municipality: Camden)
- Clay (largest municipality: Celina)
- Grundy (largest municipality: Altamont)
- Humphreys (largest municipality: Waverly)
- Lake (largest municipality: Tiptonville)
- Lauderdale (largest municipality: Ripley)
- Overton (largest municipality: Livingston)
- Perry (largest municipality: Linden)
- Smith (largest municipality: Carthage)
- Stewart (largest municipality: Dover)
- Trousdale (largest municipality: Hartsville)
- Van Buren (largest municipality: Spencer)
By congressional district
John McCain swept the state and carried 7 of the state's 9 congressional districts, including three districts held by Democrats. Barack Obama carried the state's 2 congressional districts anchored by the two largest cities of Memphis and Nashville.
| District | McCain | Obama | Representative |
|---|---|---|---|
| 1st | 69.77% | 28.77% | David Davis (110th Congress) |
| Phil Roe (111th Congress) | |||
| 2nd | 64.21% | 34.28% | John J. Duncan, Jr. |
| 3rd | 61.87% | 36.86% | Zach Wamp |
| 4th | 64.06% | 34.25% | Lincoln Davis |
| 5th | 42.94% | 55.85% | Jim Cooper |
| 6th | 61.87% | 36.59% | Bart Gordon |
| 7th | 64.76% | 34.29% | Marsha Blackburn |
| 8th | 56.01% | 42.73% | John S. Tanner |
| 9th | 22.51% | 76.92% | Steve Cohen |
Electors
Technically the voters of Tennessee cast their ballots for electors: representatives to the Electoral College. Tennessee is allocated 11 electors because it has 9 congressional districts and 2 senators. All candidates who appear on the ballot or qualify to receive write-in votes must submit a list of 11 electors, who pledge to vote for their candidate and his or her running mate. Whoever wins the majority of votes in the state is awarded all 11 electoral votes. Their chosen electors then vote for president and vice president. Although electors are pledged to their candidate and running mate, they are not obligated to vote for them.[21] An elector who votes for someone other than his or her candidate is known as a faithless elector.
The electors of each state and the District of Columbia met on December 15, 2008, to cast their votes for president and vice president. The Electoral College itself never meets as one body. Instead the electors from each state and the District of Columbia met in their respective capitols.
The following were the members of the Electoral College from the state. All 11 were pledged to John McCain and Sarah Palin:
- Sara Sellers
- Jim Haslam
- Wayne Cropp
- Lisa Wheeler
- Beth Campbell
- Albert McCall
- Shirley Curry
- Marilucile Counce
- Colin Richmond
- Winfield Dunn
- Chrystal Horn
See also
References
- "Tennessee Voter Turnout in 2008". Tennessee Secretary of State. November 4, 2008. Retrieved February 28, 2023.
{{cite news}}: CS1 maint: url-status (link) - "D.C.'s Political Report: The complete source for campaign summaries". 2009-01-01. Archived from the original on 2009-01-01. Retrieved 2021-08-23.
- "Presidential". 2015-05-05. Archived from the original on 2015-05-05. Retrieved 2021-08-23.
- "Vote 2008 - The Takeaway - Track the Electoral College vote predictions". 2009-04-22. Archived from the original on 2009-04-22. Retrieved 2021-08-23.
- "Electoral-vote.com: President, Senate, House Updated Daily". electoral-vote.com. Retrieved 2021-08-23.
- Based on Takeaway
- "POLITICO's 2008 Swing State Map - POLITICO.com". www.politico.com. Retrieved 2016-09-22.
- "RealClearPolitics - Electoral Map". Archived from the original on 2008-06-05.
- "CQ Presidential Election Maps, 2008". CQ Politics. Archived from the original on June 14, 2009. Retrieved December 20, 2009.
- Nagourney, Adam; Zeleny, Jeff; Carter, Shan (2008-11-04). "The Electoral Map: Key States". The New York Times. Retrieved May 26, 2010.
- "October – 2008 – CNN Political Ticker - CNN.com Blogs". CNN. 2008-10-31. Retrieved May 26, 2010.
- "Winning The Electoral College". Fox News. April 27, 2010.
- "roadto270". hosted.ap.org. Retrieved 2016-09-22.
- "Election 2008: Electoral College Update - Rasmussen Reports™". www.rasmussenreports.com. Retrieved 2016-09-22.
- Archived November 28, 2008, at the Wayback Machine
- "Presidential Campaign Finance". Archived from the original on January 18, 2009. Retrieved August 18, 2009.
- "Map: Campaign Ad Spending - Election Center 2008 from CNN.com". CNN. Retrieved May 26, 2010.
- "Map: Campaign Candidate Visits - Election Center 2008 from CNN.com". CNN. Retrieved May 26, 2010.
- "Election Results 2008". New York Times. Archived from the original on November 3, 2004. Retrieved 2009-05-17.
- "Official General Election Results". The Green Papers. Retrieved 2008-12-12.
- "Electoral College". California Secretary of State. Archived from the original on October 30, 2008. Retrieved 2008-11-01.