2000 United States presidential election in Tennessee
The 2000 United States presidential election in Tennessee took place on November 7, 2000, and was part of the 2000 United States presidential election. Voters chose 11 representatives, or electors to the Electoral College, who voted for president and vice president.
| ||||||||||||||||||||||||||
| Turnout | 63.03% | |||||||||||||||||||||||||
|---|---|---|---|---|---|---|---|---|---|---|---|---|---|---|---|---|---|---|---|---|---|---|---|---|---|---|
| ||||||||||||||||||||||||||
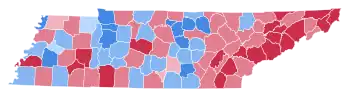 County Results
| ||||||||||||||||||||||||||
| ||||||||||||||||||||||||||


| Elections in Tennessee |
|---|
 |
|
|
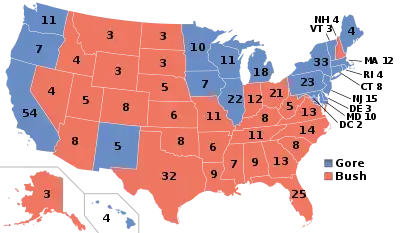
Tennessee was won by Governor George W. Bush by a 3.87% margin of victory, despite having voted for President Bill Clinton in 1992 and 1996 and being the home state of Vice President Al Gore. If Gore had carried his home state, he, instead of Bush, would have been elected president.[2]
This was the last of three consecutive elections in which Tennessee was decided by single-digit margins, and as of 2020, this is the last election with such results. Since 2000, Tennessee has rapidly moved away from swing state status and become a Republican stronghold.[3] This was also the first time a major-party candidate lost his home state since George McGovern lost South Dakota in 1972. Additionally, this was the first election where a presidential candidate won the state with more than a million votes. As of the 2020 presidential election, this is the last election in which Campbell County, Lewis County, Robertson County, Gibson County, Dickson County, Bedford County, Franklin County, Warren County, Henry County, Marshall County, Giles County, Marion County, White County, Hickman County, DeKalb County, Crockett County, Cannon County, and Decatur County voted for the Democratic candidate. Gore's victories in Marion and Campbell remain the last time that a Democrat has carried any county in staunchly Republican East Tennessee. This is also the last time that Tennessee voted to the left of Arizona, Colorado, Virginia, and North Carolina.
Results
| United States presidential election in Tennessee, 2000[4] | |||||
|---|---|---|---|---|---|
| Party | Candidate | Votes | Percentage | Electoral votes | |
| Republican | George Walker Bush | 1,061,949 | 51.15% | 11 | |
| Democratic | Albert Arnold Gore Jr. | 981,720 | 47.28% | 0 | |
| Independent | Ralph Nader | 19,781 | 0.95% | 0 | |
| Independent | Harry Edson Browne | 4,284 | 0.21% | 0 | |
| Independent | Patrick Joseph Buchanan | 4,250 | 0.20% | 0 | |
| Totals | 2,071,984 | 11 | |||
By county
| County | George W. Bush Republican | Al Gore Democratic | Other votes | Total votes | |||
|---|---|---|---|---|---|---|---|
| % | # | % | # | % | # | ||
| Anderson | 51.04% | 14,688 | 47.10% | 13,556 | 01.86% | 535 | 28,779 |
| Bedford | 48.42% | 5,911 | 50.27% | 6,136 | 01.31% | 160 | 12,207 |
| Benton | 39.36% | 2,484 | 58.63% | 3,700 | 02.01% | 127 | 6,311 |
| Bledsoe | 56.72% | 2,380 | 41.85% | 1,756 | 01.43% | 60 | 4,196 |
| Blount | 62.15% | 25,273 | 36.12% | 14,688 | 01.72% | 701 | 40,662 |
| Bradley | 68.50% | 20,167 | 29.78% | 8,768 | 01.73% | 508 | 29,443 |
| Campbell | 46.57% | 5,784 | 52.27% | 6,492 | 01.17% | 145 | 12,421 |
| Cannon | 40.96% | 1,924 | 57.42% | 2,697 | 01.62% | 76 | 4,697 |
| Carroll | 50.48% | 5,465 | 48.39% | 5,239 | 01.14% | 123 | 10,827 |
| Carter | 63.40% | 12,111 | 35.20% | 6,724 | 01.40% | 267 | 19,102 |
| Cheatham | 50.38% | 6,356 | 48.05% | 6,062 | 01.57% | 198 | 12,616 |
| Chester | 60.88% | 3,487 | 38.27% | 2,192 | 00.86% | 49 | 5,728 |
| Claiborne | 55.81% | 5,023 | 42.68% | 3,841 | 01.51% | 136 | 9,000 |
| Clay | 42.65% | 1,468 | 56.10% | 1,931 | 01.25% | 43 | 3,442 |
| Cocke | 60.41% | 6,185 | 37.82% | 3,872 | 01.78% | 182 | 10,239 |
| Coffee | 49.40% | 8,788 | 49.14% | 8,741 | 01.46% | 259 | 17,788 |
| Crockett | 49.19% | 2,676 | 49.72% | 2,705 | 01.08% | 59 | 5,440 |
| Cumberland | 57.81% | 10,994 | 40.20% | 7,644 | 01.99% | 379 | 19,017 |
| Davidson | 40.33% | 84,117 | 57.77% | 120,508 | 01.90% | 3,963 | 208,588 |
| Decatur | 46.82% | 2,046 | 52.13% | 2,278 | 01.05% | 46 | 4,370 |
| DeKalb | 38.48% | 2,411 | 60.10% | 3,765 | 01.42% | 89 | 6,265 |
| Dickson | 45.10% | 7,016 | 53.56% | 8,332 | 01.34% | 208 | 15,556 |
| Dyer | 53.05% | 6,282 | 45.82% | 5,425 | 01.13% | 134 | 11,841 |
| Fayette | 55.53% | 6,402 | 43.69% | 5,037 | 00.78% | 90 | 11,529 |
| Fentress | 56.68% | 3,417 | 41.95% | 2,529 | 01.38% | 83 | 6,029 |
| Franklin | 44.65% | 6,560 | 53.28% | 7,828 | 02.06% | 303 | 14,691 |
| Gibson | 48.35% | 8,286 | 50.55% | 8,663 | 01.10% | 188 | 17,137 |
| Giles | 43.48% | 4,377 | 54.91% | 5,527 | 01.61% | 162 | 10,066 |
| Grainger | 60.48% | 3,746 | 38.12% | 2,361 | 01.40% | 87 | 6,194 |
| Greene | 60.24% | 12,540 | 37.99% | 7,909 | 01.76% | 367 | 20,816 |
| Grundy | 33.79% | 1,553 | 64.62% | 2,970 | 01.59% | 73 | 4,596 |
| Hamblen | 60.02% | 11,824 | 38.40% | 7,564 | 01.58% | 311 | 19,699 |
| Hamilton | 55.33% | 66,605 | 42.95% | 51,708 | 01.72% | 2,066 | 120,379 |
| Hancock | 64.72% | 1,343 | 33.25% | 690 | 02.02% | 42 | 2,075 |
| Hardeman | 42.36% | 3,729 | 56.26% | 4,953 | 01.37% | 121 | 8,803 |
| Hardin | 56.38% | 4,951 | 42.53% | 3,735 | 01.09% | 96 | 8,782 |
| Hawkins | 58.90% | 10,071 | 39.50% | 6,753 | 01.60% | 274 | 17,098 |
| Haywood | 39.43% | 2,554 | 60.00% | 3,887 | 00.57% | 37 | 6,478 |
| Henderson | 61.35% | 5,153 | 37.69% | 3,166 | 00.95% | 80 | 8,399 |
| Henry | 48.29% | 5,944 | 49.50% | 6,093 | 02.21% | 272 | 12,309 |
| Hickman | 40.12% | 2,914 | 58.36% | 4,239 | 01.53% | 111 | 7,264 |
| Houston | 31.76% | 993 | 66.55% | 2,081 | 01.69% | 53 | 3,127 |
| Humphreys | 35.73% | 2,387 | 62.94% | 4,205 | 01.33% | 89 | 6,681 |
| Jackson | 29.11% | 1,384 | 69.50% | 3,304 | 01.39% | 66 | 4,754 |
| Jefferson | 61.45% | 8,657 | 37.10% | 5,226 | 01.45% | 204 | 14,087 |
| Johnson | 66.11% | 3,740 | 32.05% | 1,813 | 01.84% | 104 | 5,657 |
| Knox | 57.68% | 86,851 | 40.49% | 60,969 | 01.84% | 2,766 | 150,586 |
| Lake | 35.12% | 781 | 63.80% | 1,419 | 01.08% | 24 | 2,224 |
| Lauderdale | 43.70% | 3,329 | 55.45% | 4,224 | 00.85% | 65 | 7,618 |
| Lawrence | 52.61% | 7,613 | 45.91% | 6,643 | 01.48% | 214 | 14,470 |
| Lewis | 46.09% | 2,037 | 51.61% | 2,281 | 02.31% | 102 | 4,420 |
| Lincoln | 50.99% | 5,435 | 47.47% | 5,060 | 01.54% | 164 | 10,659 |
| Loudon | 62.57% | 10,266 | 35.99% | 5,905 | 01.43% | 235 | 16,406 |
| Macon | 51.86% | 3,366 | 47.13% | 3,059 | 01.02% | 66 | 6,491 |
| Madison | 52.64% | 17,862 | 46.51% | 15,781 | 00.85% | 287 | 33,930 |
| Marion | 45.38% | 4,651 | 53.08% | 5,441 | 01.54% | 158 | 10,250 |
| Marshall | 43.86% | 4,105 | 54.57% | 5,107 | 01.57% | 147 | 9,359 |
| Maury | 50.98% | 11,930 | 47.55% | 11,127 | 01.47% | 343 | 23,400 |
| McMinn | 61.17% | 10,155 | 37.00% | 6,142 | 01.83% | 303 | 16,600 |
| McNairy | 54.48% | 4,897 | 44.53% | 4,003 | 00.99% | 89 | 8,989 |
| Meigs | 53.01% | 1,797 | 45.87% | 1,555 | 01.12% | 38 | 3,390 |
| Monroe | 57.79% | 7,514 | 40.97% | 5,327 | 01.25% | 162 | 13,003 |
| Montgomery | 50.31% | 19,644 | 48.20% | 18,818 | 01.49% | 582 | 39,044 |
| Moore | 49.76% | 1,145 | 48.11% | 1,107 | 02.13% | 49 | 2,301 |
| Morgan | 51.02% | 3,144 | 47.40% | 2,921 | 01.57% | 97 | 6,162 |
| Obion | 49.58% | 6,168 | 48.68% | 6,056 | 01.74% | 216 | 12,440 |
| Overton | 38.35% | 2,875 | 60.13% | 4,507 | 01.52% | 114 | 7,496 |
| Perry | 40.65% | 1,165 | 57.57% | 1,650 | 01.78% | 51 | 2,866 |
| Pickett | 57.21% | 1,281 | 41.94% | 939 | 00.85% | 19 | 2,239 |
| Polk | 51.97% | 2,907 | 46.01% | 2,574 | 02.02% | 113 | 5,594 |
| Putnam | 50.13% | 11,248 | 48.07% | 10,785 | 01.80% | 405 | 22,438 |
| Rhea | 60.38% | 5,900 | 38.09% | 3,722 | 01.53% | 150 | 9,772 |
| Roane | 53.20% | 11,345 | 44.90% | 9,575 | 01.90% | 406 | 21,326 |
| Robertson | 47.98% | 9,675 | 50.83% | 10,249 | 01.19% | 240 | 20,164 |
| Rutherford | 53.79% | 33,445 | 44.00% | 27,360 | 02.21% | 1,377 | 62,182 |
| Scott | 54.10% | 3,579 | 44.85% | 2,967 | 01.04% | 69 | 6,615 |
| Sequatchie | 55.80% | 2,169 | 42.40% | 1,648 | 01.80% | 70 | 3,887 |
| Sevier | 65.97% | 16,734 | 32.36% | 8,208 | 01.67% | 423 | 25,365 |
| Shelby | 42.09% | 141,756 | 56.54% | 190,404 | 01.36% | 4,595 | 336,755 |
| Smith | 32.44% | 2,384 | 66.47% | 4,884 | 01.09% | 80 | 7,348 |
| Stewart | 38.18% | 1,826 | 60.02% | 2,870 | 01.80% | 86 | 4,782 |
| Sullivan | 60.08% | 33,482 | 38.32% | 21,354 | 01.60% | 891 | 55,727 |
| Sumner | 54.68% | 27,601 | 43.82% | 22,118 | 01.50% | 758 | 50,477 |
| Tipton | 60.84% | 10,070 | 38.06% | 6,300 | 01.10% | 182 | 16,552 |
| Trousdale | 32.26% | 950 | 66.76% | 1,966 | 00.98% | 29 | 2,945 |
| Unicoi | 58.80% | 3,780 | 39.91% | 2,566 | 01.29% | 83 | 6,429 |
| Union | 54.96% | 3,199 | 44.05% | 2,564 | 01.00% | 58 | 5,821 |
| Van Buren | 39.65% | 845 | 58.89% | 1,255 | 01.45% | 31 | 2,131 |
| Warren | 42.28% | 5,552 | 56.19% | 7,378 | 01.53% | 201 | 13,131 |
| Washington | 59.51% | 22,579 | 38.93% | 14,769 | 01.57% | 594 | 37,942 |
| Wayne | 63.51% | 3,370 | 35.04% | 1,859 | 01.45% | 77 | 5,306 |
| Weakley | 51.55% | 6,106 | 47.03% | 5,570 | 01.42% | 168 | 11,844 |
| White | 45.34% | 3,525 | 53.18% | 4,135 | 01.48% | 115 | 7,775 |
| Williamson | 66.58% | 38,901 | 32.08% | 18,745 | 01.34% | 783 | 58,429 |
| Wilson | 52.47% | 18,844 | 46.11% | 16,561 | 01.42% | 511 | 35,916 |
Counties that flipped from Democratic to Republican
- Anderson (Largest city: Oak Ridge)
- Carroll (Largest city: McKenzie)
- Cheatham (Largest city: Ashland City)
- Coffee (Largest city: Tullahoma)
- Dyer (Largest city: Dyersburg)
- Fayette (Largest town: Oakland)
- Fentress (Largest city: Jamestown)
- Lawrence (Largest city: Lawrenceburg)
- Maury (Largest city: Columbia)
- McNairy (Largest city: Selmer)
- Meigs (Largest city: Decatur)
- Montgomery (Largest city: Clarksville)
- Moore (Largest city: Lynchburg)
- Morgan (Largest city: Coalfield)
- Obion (Largest city: Union City)
- Polk (Largest city: Benton)
- Putnam (Largest city: Cookeville)
- Roane (Largest city: Oak Ridge)
- Sequatchie (Largest city: Dunlap)
- Union (Largest city: Maynardville)
- Weakley (Largest city: Martin)
By Congressional District
Bush won 6 of the 9 congressional districts, including one held by a Democrat.[5]
| District | Bush | Gore | Representative |
|---|---|---|---|
| 1st | 61% | 38% | Bill Jenkins |
| 2nd | 59% | 39% | Jimmy Duncan |
| 3rd | 57% | 41% | Zach Wamp |
| 4th | 50% | 49% | Van Hilleary |
| 5th | 42% | 57% | Bob Clement |
| 6th | 49% | 49% | Bart Gordon |
| 7th | 59% | 40% | Ed Bryant |
| 8th | 48% | 51% | John S. Tanner |
| 9th | 36% | 63% | Harold Ford Jr. |
Electors
The electors of each state and the District of Columbia met on December 18, 2000[6] to cast their votes for president and vice president. The Electoral College itself never meets as one body. Instead the electors from each state and the District of Columbia met in their respective capitols.
The following were the members of the Electoral College from the state. All were pledged to and voted for George Bush and Dick Cheney:[7]
- Lamar Alexander
- Daniel Dirksen Baker
- Lana Bowman Ball
- Nancy Cunningham
- Winfield Dunn
- Jimmy Exum
- Jim Henry
- Raja Jubran
- Anie Kent
- Patti Saliba
- Mamon Wright
References
- "Tennessee Voter Turnout in 2000". Tennessee Secretary of State. November 7, 2000. Retrieved February 28, 2023.
{{cite news}}: CS1 maint: url-status (link) - Perez-Pena, Richard (9 November 2000). "THE 2000 ELECTIONS: TENNESSEE; Loss in Home State Leaves Gore Depending on Florida". The New York Times.
- "Our Campaigns - Container Detail Page". www.ourcampaigns.com. Retrieved 2020-05-25.
- "Dave Leip's Atlas of U.S. Presidential Elections".
- "Swing State Project".
- 2000 Presidential General Election Results - Pennsylvania
- "President Elect - 2000". presidentelect.org. Archived from the original on 3 March 2009. Retrieved 11 January 2022.