1984 United States presidential election in Washington (state)
The 1984 United States presidential election in Washington took place on November 6, 1984. All 50 states and the District of Columbia, were part of the 1984 United States presidential election. Voters chose ten electors to the Electoral College, which selected the president and vice president of the United States.
| ||||||||||||||||||||||||||
| ||||||||||||||||||||||||||
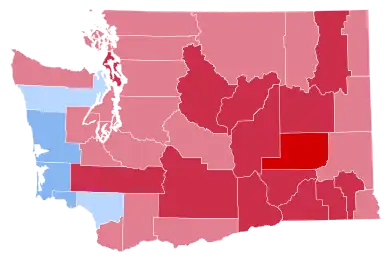 County Results
| ||||||||||||||||||||||||||
| ||||||||||||||||||||||||||
.jpg.webp)
.jpg.webp)
| Elections in Washington |
|---|
 |
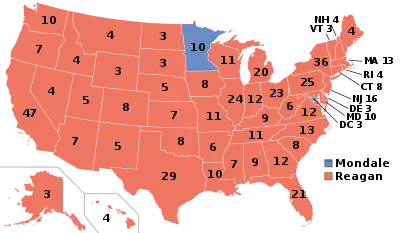
The State of Washington was won by incumbent United States President Ronald Reagan of California, who was running against former Vice President Walter Mondale of Minnesota. Reagan ran for a second time with incumbent Vice President and former C.I.A. Director George H. W. Bush of Texas, and Mondale ran with Representative Geraldine Ferraro of New York, the first major female candidate for the vice presidency.
Nearly all counties in Washington voted mainly Republican, save a handful of counties along the southern Pacific coast of the state, which voted mainly Democratic. This included Seattle's highly populated King County, which is the most recent time Seattle has voted Republican. This is also the last time that Pierce County, Thurston County, and San Juan County voted Republican.[1]
Washington weighed in for this election as 3% more Democratic than the national average. This is the last time Washington has voted for a Republican in a presidential election, though Colin Powell would receive the votes of three faithless electors in 2016. As of the 2020 presidential election, this is the last election where the Republican candidate won King County, home of Washington's largest city, Seattle.
The presidential election of 1984 was a very partisan election for Washington, with over 98 percent of the electorate voting for either the Democratic or Republican parties.[2]
Results
| United States presidential election in Washington, 1984 | |||||
|---|---|---|---|---|---|
| Party | Candidate | Votes | Percentage | Electoral votes | |
| Republican | Ronald Reagan | 1,051,670 | 55.82% | 10 | |
| Democratic | Walter Mondale | 807,352 | 42.86% | 0 | |
| Libertarian | David Bergland | 8,844 | 0.47% | 0 | |
| America First | Bob Richards | 5,724 | 0.30% | 0 | |
| Independent | Lyndon LaRouche | 4,712 | 0.25% | 0 | |
| Citizens Party | Sonia Johnson | 1,891 | 0.10% | 0 | |
| New Alliance Party | Dennis Serrette | 1,654 | 0.09% | 0 | |
| Communist Party | Gus Hall | 814 | 0.04% | 0 | |
| Workers World Party | Larry Holmes | 641 | 0.03% | 0 | |
| Socialist Workers Party | Melvin Mason | 608 | 0.03% | 0 | |
| Totals | 1,883,910 | 100.0% | 10 | ||
Results by county
| Ronald Wilson Reagan Republican |
Walter Fritz Mondale Democratic |
Various candidates Other parties |
Margin | Total votes cast | |||||
|---|---|---|---|---|---|---|---|---|---|
| County | # | % | # | % | # | % | # | % | # |
| Adams | 3,449 | 71.72% | 1,311 | 27.26% | 49 | 1.02% | 2,138 | 44.46% | 4,809 |
| Asotin | 3,876 | 55.21% | 3,042 | 43.33% | 103 | 1.47% | 834 | 11.88% | 7,021 |
| Benton | 32,307 | 69.28% | 13,784 | 29.56% | 540 | 1.16% | 18,523 | 39.72% | 46,631 |
| Chelan | 13,667 | 65.10% | 6,978 | 33.24% | 349 | 1.66% | 6,689 | 31.86% | 20,994 |
| Clallam | 13,605 | 57.32% | 9,701 | 40.87% | 429 | 1.81% | 3,904 | 16.45% | 23,735 |
| Clark | 40,681 | 52.86% | 35,248 | 45.80% | 1,028 | 1.34% | 5,433 | 7.06% | 76,957 |
| Columbia | 1,404 | 67.02% | 673 | 32.12% | 18 | 0.86% | 731 | 34.89% | 2,095 |
| Cowlitz | 14,858 | 47.98% | 15,361 | 49.60% | 749 | 2.42% | -503 | -1.62% | 30,968 |
| Douglas | 6,443 | 66.44% | 3,127 | 32.24% | 128 | 1.32% | 3,316 | 34.19% | 9,698 |
| Ferry | 1,232 | 55.75% | 935 | 42.31% | 43 | 1.95% | 297 | 13.44% | 2,210 |
| Franklin | 7,724 | 62.96% | 4,328 | 35.28% | 216 | 1.76% | 3,396 | 27.68% | 12,268 |
| Garfield | 913 | 63.94% | 493 | 34.52% | 22 | 1.54% | 420 | 29.41% | 1,428 |
| Grant | 12,888 | 65.81% | 6,298 | 32.16% | 398 | 2.03% | 6,590 | 33.65% | 19,584 |
| Grays Harbor | 11,286 | 43.96% | 14,050 | 54.73% | 335 | 1.30% | -2,764 | -10.77% | 25,671 |
| Island | 13,548 | 65.72% | 6,850 | 33.23% | 218 | 1.06% | 6,698 | 32.49% | 20,616 |
| Jefferson | 4,543 | 48.67% | 4,602 | 49.30% | 189 | 2.02% | -59 | -0.63% | 9,334 |
| King | 332,987 | 52.09% | 298,620 | 46.71% | 7,654 | 1.20% | 34,367 | 5.38% | 639,261 |
| Kitsap | 36,101 | 54.11% | 29,681 | 44.49% | 931 | 1.40% | 6,420 | 9.62% | 66,713 |
| Kittitas | 6,580 | 57.06% | 4,830 | 41.89% | 121 | 1.05% | 1,750 | 15.18% | 11,531 |
| Klickitat | 3,910 | 57.87% | 2,712 | 40.14% | 135 | 2.00% | 1,198 | 17.73% | 6,757 |
| Lewis | 15,846 | 66.22% | 7,634 | 31.90% | 451 | 1.88% | 8,212 | 34.32% | 23,931 |
| Lincoln | 3,474 | 66.90% | 1,671 | 32.18% | 48 | 0.92% | 1,803 | 34.72% | 5,193 |
| Mason | 8,410 | 53.74% | 7,007 | 44.77% | 233 | 1.49% | 1,403 | 8.96% | 15,650 |
| Okanogan | 7,476 | 57.25% | 5,330 | 40.81% | 253 | 1.94% | 2,146 | 16.43% | 13,059 |
| Pacific | 3,613 | 42.90% | 4,679 | 55.56% | 129 | 1.53% | -1,066 | -12.66% | 8,421 |
| Pend Oreille | 2,374 | 58.26% | 1,655 | 40.61% | 46 | 1.13% | 719 | 17.64% | 4,075 |
| Pierce | 112,877 | 57.85% | 79,498 | 40.75% | 2,733 | 1.40% | 33,379 | 17.11% | 195,108 |
| San Juan | 2,900 | 52.48% | 2,514 | 45.49% | 112 | 2.03% | 386 | 6.99% | 5,526 |
| Skagit | 18,840 | 56.53% | 13,947 | 41.85% | 539 | 1.62% | 4,893 | 14.68% | 33,326 |
| Skamania | 1,736 | 51.99% | 1,552 | 46.48% | 51 | 1.53% | 184 | 5.51% | 3,339 |
| Snohomish | 90,362 | 56.83% | 66,728 | 41.97% | 1,905 | 1.20% | 23,634 | 14.86% | 158,995 |
| Spokane | 88,043 | 58.96% | 59,620 | 39.92% | 1,673 | 1.12% | 28,423 | 19.03% | 149,336 |
| Stevens | 8,211 | 64.29% | 4,304 | 33.70% | 256 | 2.00% | 3,907 | 30.59% | 12,771 |
| Thurston | 34,442 | 55.51% | 26,840 | 43.26% | 763 | 1.23% | 7,602 | 12.25% | 62,045 |
| Wahkiakum | 776 | 44.62% | 930 | 53.48% | 33 | 1.90% | -154 | -8.86% | 1,739 |
| Walla Walla | 12,361 | 63.72% | 6,804 | 35.08% | 233 | 1.20% | 5,557 | 28.65% | 19,398 |
| Whatcom | 27,228 | 53.72% | 22,670 | 44.73% | 788 | 1.55% | 4,558 | 8.99% | 50,686 |
| Whitman | 10,021 | 59.48% | 6,621 | 39.30% | 207 | 1.23% | 3,400 | 20.18% | 16,849 |
| Yakima | 40,678 | 61.46% | 24,724 | 37.36% | 780 | 1.18% | 15,954 | 24.11% | 66,182 |
| Totals | 1,051,670 | 55.82% | 807,352 | 42.86% | 24,888 | 1.32% | 244,318 | 12.97% | 1,883,910 |
References
- Sullivan, Robert David; ‘How the Red and Blue Map Evolved Over the Past Century’; America Magazine in The National Catholic Review; June 29, 2016
- "1984 Presidential General Election Results – Washington". Dave Leip's Atlas of U.S. Presidential Elections. Retrieved 2018-01-26.