2016 United States presidential election in Missouri
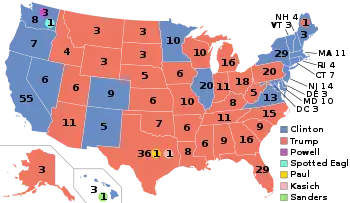
The 2016 United States presidential election in Missouri was held on Tuesday, November 8, 2016, as part of the 2016 United States presidential election in which all 50 states plus the District of Columbia participated. Missouri voters chose electors to represent them in the Electoral College via a popular vote, pitting the Republican Party's nominee, businessman Donald Trump, and running mate Indiana Governor Mike Pence against Democratic Party nominee, former Secretary of State Hillary Clinton, and her running mate Virginia Senator Tim Kaine. Missouri has 10 electoral votes in the Electoral College.[2]
| ||||||||||||||||||||||||||
| Turnout | 66.56% | |||||||||||||||||||||||||
|---|---|---|---|---|---|---|---|---|---|---|---|---|---|---|---|---|---|---|---|---|---|---|---|---|---|---|
| ||||||||||||||||||||||||||
| ||||||||||||||||||||||||||
| ||||||||||||||||||||||||||
.jpg.webp)
| Elections in Missouri |
|---|
 |
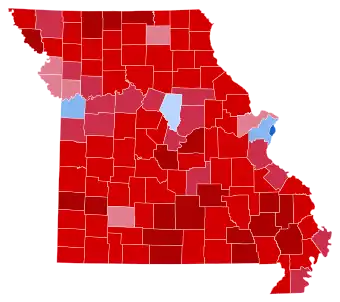
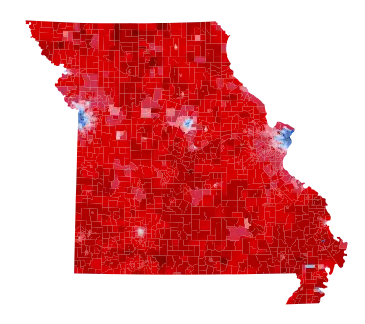
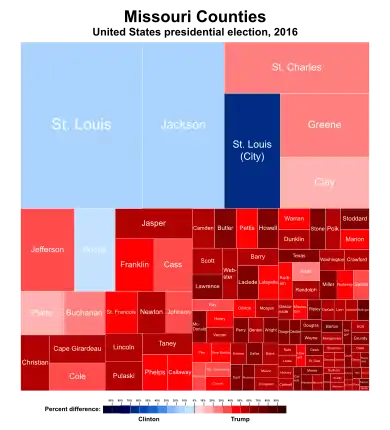
Trump carried the state with 56.4% of the vote, while Clinton received 37.9%.[3] Trump's 18.5-point margin of victory in the state was almost double that of Mitt Romney's from 2012. Clinton carried only four jurisdictions: Boone County, home to Columbia and the University of Missouri; Jackson County, which includes most of Kansas City; St. Louis County; and St. Louis City. Clinton's vote share percentage was the lowest a Democratic presidential nominee obtained in the state since George McGovern's 37.7% in 1972, further cementing the state's drift towards the Republican Party and away from its long-held status as a bellwether state. Missouri was also one of eleven states that voted for Bill Clinton in 1992 and 1996 but were lost by Hillary Clinton in 2016. Additionally, this was the first time since 1984 that Missouri voted by double digits for the Republican candidate, and the first time since 1992 that the state voted by double digits for either candidate. As of 2020, this is the largest loss by a Democrat since Democratic nominee Walter Mondale in 1984.
Primary elections
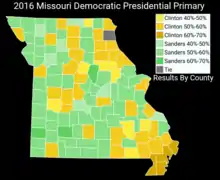
Democratic primary
Nine candidates appeared on the Democratic presidential primary ballot:[4]
- Hillary Clinton
- Henry Hewes
- Rocky De La Fuente
- Bernie Sanders
- Keith Judd
- Willie L. Wilson
- Martin O'Malley (withdrawn)
- John Wolfe Jr.
- Jon Adams
| Candidate | Popular vote | Estimated delegates | |||
|---|---|---|---|---|---|
| Count | Percentage | Pledged | Unpledged | Total | |
| Hillary Clinton | 310,600 | 49.61% | 36 | 11 | 47 |
| Bernie Sanders | 309,073 | 49.37% | 35 | 0 | 35 |
| Uncommitted | 3,697 | 0.59% | 0 | 2 | 2 |
| Henry Hewes | 651 | 0.10% | 0 | 0 | 0 |
| Martin O'Malley (withdrawn) | 437 | 0.07% | 0 | 0 | 0 |
| Jon Adams | 428 | 0.07% | 0 | 0 | 0 |
| Rocky De La Fuente | 340 | 0.05% | 0 | 0 | 0 |
| Willie Wilson | 305 | 0.05% | 0 | 0 | 0 |
| Keith Judd | 284 | 0.05% | 0 | 0 | 0 |
| John Wolfe | 245 | 0.04% | 0 | 0 | 0 |
| Total | 626,060 | 100% | 71 | 13 | 84 |
| Source:The Green Papers | |||||
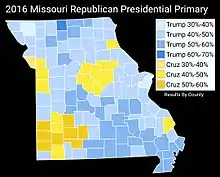
Republican primary
Twelve candidates appeared on the Republican presidential primary ballot:[4]
- Jeb Bush (withdrawn)
- Ben Carson (withdrawn)
- Chris Christie (withdrawn)
- Ted Cruz
- Carly Fiorina (withdrawn)
- Mike Huckabee (withdrawn)
- John Kasich
- Rand Paul (withdrawn)
- Marco Rubio (withdrawn)
- Rick Santorum (withdrawn)
- Donald Trump
| Candidate | Votes | Percentage | Actual delegate count | ||
|---|---|---|---|---|---|
| Bound | Unbound | Total | |||
| Donald Trump | 383,631 | 40.84% | 37 | 0 | 37 |
| Ted Cruz | 381,666 | 40.63% | 15 | 0 | 15 |
| John Kasich | 94,857 | 10.10% | 0 | 0 | 0 |
| Marco Rubio | 57,244 | 6.09% | 0 | 0 | 0 |
| Ben Carson (withdrawn) | 8,233 | 0.88% | 0 | 0 | 0 |
| Jeb Bush (withdrawn) | 3,361 | 0.36% | 0 | 0 | 0 |
| Uncommitted | 3,225 | 0.34% | 0 | 0 | 0 |
| Mike Huckabee (withdrawn) | 2,148 | 0.23% | 0 | 0 | 0 |
| Rand Paul (withdrawn) | 1,777 | 0.19% | 0 | 0 | 0 |
| Chris Christie (withdrawn) | 1,681 | 0.18% | 0 | 0 | 0 |
| Rick Santorum (withdrawn) | 732 | 0.08% | 0 | 0 | 0 |
| Carly Fiorina (withdrawn) | 615 | 0.07% | 0 | 0 | 0 |
| Jim Lynch (withdrawn) | 100 | 0.01% | 0 | 0 | 0 |
| Unprojected delegates: | 0 | 0 | 0 | ||
| Total: | 939,270 | 100.00% | 52 | 0 | 52 |
| Source: The Green Papers | |||||
Libertarian primary
The Missouri primary ran on March 15, 2016, alongside those of the Republican, Democratic, and Constitution parties. 40% of the electorate voted to stand uncommitted to any candidate. Austin Petersen, running in his home state, finished second, with 29% of the statewide vote, which was double that of Steve Kerbel from Colorado, who finished third, with 14%. Petersen comfortably won the support of voters in the state's capital, Jefferson City, and its surrounding counties, but was fell heavily behind the uncommitted vote in the state's two largest cities, Kansas City and St. Louis. Kerbel won three counties around Springfield, while Marc Allan Feldman, Cecil Ince, and Rhett Smith all won a sprawl of counties across the state; in most of these counties, however, only a single vote was cast. No votes were cast for Libertarian Party candidates in the northwestern counties of Harrison, Holt, Mercer, and Worth.[5]
| Candidate | Votes | Percentage |
|---|---|---|
| 1,183 | 40.61% | |
| Austin Petersen | 854 | 29.32% |
| Steve Kerbel | 401 | 13.77% |
| Marc Allan Feldman | 242 | 8.31% |
| Cecil Ince | 134 | 4.60% |
| Rhett Smith | 99 | 3.40% |
| Total | 2,913 | 100% |
General election
Polling
Republican Donald Trump won every pre-election poll conducted here except one. Trump won most polls by high single digits or low double digits. The average of the last three polls had Donald Trump leading Democrat Hillary Clinton 50% to 39%.[6]
Predictions
The following are final 2016 predictions from various organizations for Missouri as of Election Day.
| Source | Ranking | As of |
|---|---|---|
| Los Angeles Times[7] | Likely R | November 6, 2016 |
| CNN[8] | Safe R | November 4, 2016 |
| Cook Political Report[9] | Likely R | November 7, 2016 |
| Electoral-vote.com[10] | Safe R | November 8, 2016 |
| Rothenberg Political Report[11] | Likely R | November 7, 2016 |
| Sabato's Crystal Ball[12] | Safe R | November 7, 2016 |
| RealClearPolitics[13] | Likely R | November 8, 2016 |
| Fox News[14] | Safe R | November 7, 2016 |
Results
The statewide election results were as follows. The total vote count was 2,828,266.[15]
| U.S. President and Vice President | Party | Votes | % of Votes |
|---|---|---|---|
| Donald J. Trump, Michael R. Pence | Republican | 1,594,511 | 56.38% |
| Hillary Rodham Clinton, Timothy Michael Kaine | Democratic | 1,071,068 | 37.87% |
| Gary Johnson, Bill Weld | Libertarian | 97,359 | 3.44% |
| Jill Stein, Ajamu Baraka | Green | 25,419 | 0.90% |
| Other Write-ins | 19,663 | 0.70% | |
| Darrell L. Castle, Scott N. Bradley | Constitution | 13,092 | 0.46% |
| Evan McMullin, Nathan Johnson | Write-in | 7,071 | 0.25% |
| Tom Hoefling, Steve Schulin | Write-in | 48 | <0.01% |
| Laurence Kotlikoff, Edward Leamer | Write-in | 28 | <0.01% |
| "Rocky" Roque De La Fuente, Michael Steinberg | Write-in | 6 | <0.01% |
| Marshall Schoenke, James Creighton Mitchell Jr. | Write-in | 3 | <0.01% |
| Matias Mollin, Andy Oliver | Write-in | 0 | 0.00% |
| Totals | 2,828,266 | 100% | |
By county
| Hillary Rodham Clinton
Democratic |
Donald John Trump
Republican |
Various candidates
Other parties |
Margin | Total | |||||
|---|---|---|---|---|---|---|---|---|---|
| County | % | # | % | # | # | % | # | % | # |
| Adair | 3,500 | 34.23% | 6,030 | 58.97% | 696 | 6.81% | 2,530 | 24.74% | 10,226 |
| Andrew | 2,045 | 22.37% | 6,665 | 72.92% | 430 | 4.70% | 4,620 | 50.55% | 9,140 |
| Atchison | 541 | 19.82% | 2,060 | 75.46% | 129 | 4.73% | 1,519 | 55.64% | 2,730 |
| Audrain | 2,570 | 25.54% | 6,981 | 69.39% | 510 | 5.07% | 4,411 | 43.84% | 10,061 |
| Barry | 2,710 | 18.56% | 11,428 | 78.25% | 467 | 3.20% | 8,718 | 59.69% | 14,605 |
| Barton | 795 | 13.39% | 4,959 | 83.50% | 185 | 3.12% | 4,164 | 70.11% | 5,939 |
| Bates | 1,618 | 20.15% | 6,001 | 74.72% | 412 | 5.13% | 4,383 | 54.58% | 8,031 |
| Benton | 2,025 | 21.12% | 7,213 | 75.21% | 352 | 3.67% | 5,188 | 54.10% | 9,590 |
| Bollinger | 705 | 12.42% | 4,827 | 85.04% | 144 | 2.54% | 4,122 | 72.62% | 5,676 |
| Boone | 41,125 | 49.04% | 36,200 | 43.16% | 6,543 | 7.80% | -4,925 | -5.87% | 83,868 |
| Buchanan | 12,013 | 33.69% | 21,320 | 59.79% | 2,326 | 6.52% | 9,307 | 26.10% | 35,659 |
| Butler | 3,036 | 17.59% | 13,650 | 79.09% | 573 | 3.32% | 10,614 | 61.50% | 17,259 |
| Caldwell | 838 | 19.43% | 3,232 | 74.95% | 242 | 5.61% | 2,394 | 55.52% | 4,312 |
| Callaway | 4,989 | 25.99% | 13,057 | 68.03% | 1,147 | 5.98% | 8,068 | 42.04% | 19,193 |
| Camden | 4,768 | 21.18% | 16,944 | 75.26% | 802 | 3.56% | 12,176 | 54.08% | 22,514 |
| Cape Girardeau | 8,492 | 22.93% | 27,017 | 72.94% | 1,529 | 4.13% | 18,525 | 50.02% | 37,038 |
| Carroll | 745 | 17.08% | 3,480 | 79.80% | 136 | 3.12% | 2,735 | 62.71% | 4,361 |
| Carter | 436 | 15.30% | 2,324 | 81.54% | 90 | 3.16% | 1,888 | 66.25% | 2,850 |
| Cass | 14,846 | 29.12% | 33,098 | 64.91% | 3,046 | 5.97% | 18,252 | 35.80% | 50,990 |
| Cedar | 1,011 | 16.08% | 5,021 | 79.85% | 256 | 4.07% | 6,288 | ||
| Chariton | 888 | 22.37% | 2,950 | 74.33% | 131 | 3.30% | 3,969 | ||
| Christian | 8,508 | 20.49% | 30,946 | 74.51% | 2,077 | 5.00% | 41,531 | ||
| Clark | 724 | 21.83% | 2,458 | 74.13% | 134 | 4.04% | 3,316 | ||
| Clay | 45,304 | 41.12% | 57,476 | 52.17% | 7,396 | 6.71% | 110,176 | ||
| Clinton | 2,572 | 25.20% | 7,067 | 69.23% | 569 | 5.57% | 10,208 | ||
| Cole | 10,913 | 29.20% | 24,616 | 65.86% | 1,845 | 4.94% | 37,374 | ||
| Cooper | 1,932 | 24.19% | 5,624 | 70.42% | 430 | 5.38% | 7,986 | ||
| Crawford | 1,824 | 18.39% | 7,724 | 77.86% | 372 | 3.75% | 9,920 | ||
| Dade | 637 | 16.12% | 3,184 | 80.59% | 130 | 3.29% | 3,951 | ||
| Dallas | 1,272 | 17.07% | 5,895 | 79.10% | 286 | 3.84% | 7,453 | ||
| Daviess | 730 | 19.53% | 2,767 | 74.02% | 241 | 6.45% | 3,738 | ||
| DeKalb | 824 | 17.94% | 3,540 | 77.06% | 230 | 5.01% | 4,594 | ||
| Dent | 978 | 14.40% | 5,600 | 82.46% | 213 | 3.14% | 6,791 | ||
| Douglas | 984 | 14.76% | 5,486 | 82.30% | 196 | 2.94% | 6,666 | ||
| Dunklin | 2,360 | 22.31% | 8,026 | 75.87% | 192 | 1.82% | 10,578 | ||
| Franklin | 12,341 | 24.63% | 35,430 | 70.70% | 2,342 | 4.67% | 50,113 | ||
| Gasconade | 1,520 | 20.40% | 5,670 | 76.10% | 261 | 3.50% | 7,451 | ||
| Gentry | 605 | 19.88% | 2,304 | 75.71% | 134 | 4.40% | 3,043 | ||
| Greene | 42,728 | 33.06% | 78,035 | 60.38% | 8,468 | 6.55% | 129,231 | ||
| Grundy | 780 | 17.62% | 3,462 | 78.18% | 186 | 4.20% | 4,428 | ||
| Harrison | 574 | 15.56% | 2,965 | 80.37% | 150 | 4.07% | 3,689 | ||
| Henry | 2,357 | 23.89% | 7,075 | 71.71% | 434 | 4.40% | 9,866 | ||
| Hickory | 1,016 | 21.51% | 3,542 | 74.98% | 166 | 3.51% | 4,724 | ||
| Holt | 347 | 14.73% | 1,926 | 81.78% | 82 | 3.48% | 2,355 | ||
| Howard | 1,283 | 26.36% | 3,277 | 67.32% | 308 | 6.33% | 4,868 | ||
| Howell | 2,881 | 16.51% | 13,893 | 79.59% | 681 | 3.90% | 17,455 | ||
| Iron | 933 | 21.86% | 3,173 | 74.33% | 163 | 3.82% | 4,269 | ||
| Jackson | 168,972 | 55.70% | 116,211 | 39.0% | 10,481 | 6.05% | 295,664 | ||
| Jasper | 10,572 | 21.88% | 35,070 | 72.57% | 2,684 | 5.55% | 48,326 | ||
| Jefferson | 31,568 | 29.71% | 69,036 | 64.98% | 5,634 | 5.30% | 106,238 | ||
| Johnson | 5,930 | 28.06% | 13,719 | 64.92% | 1,483 | 7.02% | 21,132 | ||
| Knox | 379 | 20.27% | 1,416 | 75.72% | 75 | 4.01% | 1,870 | ||
| Laclede | 2,553 | 15.91% | 12,881 | 80.25% | 617 | 3.84% | 16,051 | ||
| Lafayette | 4,053 | 25.53% | 10,988 | 69.21% | 835 | 5.26% | 15,876 | ||
| Lawrence | 2,901 | 17.36% | 13,089 | 78.31% | 725 | 4.34% | 16,715 | ||
| Lewis | 934 | 20.96% | 3,344 | 75.04% | 178 | 3.99% | 4,456 | ||
| Lincoln | 5,575 | 22.33% | 18,159 | 72.75% | 1,228 | 4.92% | 24,962 | ||
| Linn | 1,240 | 22.19% | 4,088 | 73.17% | 259 | 4.64% | 5,587 | ||
| Livingston | 1,265 | 19.70% | 4,879 | 75.99% | 277 | 4.31% | 6,421 | ||
| Macon | 1,548 | 20.29% | 5,798 | 75.98% | 285 | 3.73% | 7,631 | ||
| Madison | 1,005 | 18.89% | 4,102 | 77.09% | 214 | 4.02% | 5,321 | ||
| Maries | 794 | 17.64% | 3,561 | 79.13% | 145 | 3.22% | 4,500 | ||
| Marion | 2,994 | 23.14% | 9,419 | 72.80% | 525 | 4.06% | 12,938 | ||
| McDonald | 1,329 | 16.12% | 6,599 | 80.07% | 314 | 3.81% | 8,242 | ||
| Mercer | 216 | 12.38% | 1,486 | 85.16% | 43 | 2.46% | 1,745 | ||
| Miller | 1,750 | 15.33% | 9,285 | 81.33% | 381 | 3.34% | 11,416 | ||
| Mississippi | 1,458 | 28.21% | 3,600 | 69.65% | 111 | 2.15% | 5,169 | ||
| Moniteau | 1,237 | 18.11% | 5,347 | 78.29% | 246 | 3.60% | 6,830 | ||
| Monroe | 853 | 20.52% | 3,159 | 76.01% | 144 | 3.46% | 4,156 | ||
| Montgomery | 1,119 | 20.61% | 4,127 | 76.02% | 183 | 3.37% | 5,429 | ||
| Morgan | 1,768 | 20.04% | 6,760 | 76.64% | 293 | 3.32% | 8,821 | ||
| New Madrid | 1,933 | 26.27% | 5,270 | 71.63% | 154 | 2.09% | 7,357 | ||
| Newton | 4,990 | 18.76% | 20,553 | 77.25% | 1,063 | 4.00% | 26,606 | ||
| Nodaway | 2,529 | 26.74% | 6,380 | 67.46% | 549 | 5.80% | 9,458 | ||
| Oregon | 865 | 18.53% | 3,671 | 78.64% | 132 | 2.83% | 4,668 | ||
| Osage | 998 | 14.08% | 5,856 | 82.60% | 236 | 3.33% | 7,090 | ||
| Ozark | 724 | 16.07% | 3,639 | 80.78% | 142 | 3.15% | 4,505 | ||
| Pemiscot | 1,947 | 32.30% | 3,964 | 65.77% | 116 | 1.92% | 6,027 | ||
| Perry | 1,520 | 17.39% | 6,908 | 79.04% | 312 | 3.57% | 8,740 | ||
| Pettis | 4,324 | 23.87% | 12,810 | 70.73% | 977 | 5.39% | 18,111 | ||
| Phelps | 4,766 | 25.69% | 12,709 | 68.50% | 1,078 | 5.81% | 18,553 | ||
| Pike | 1,806 | 24.46% | 5,274 | 71.44% | 302 | 4.09% | 7,382 | ||
| Platte | 20,057 | 40.85% | 25,933 | 52.82% | 3,110 | 6.33% | 49,100 | ||
| Polk | 2,631 | 19.12% | 10,438 | 75.84% | 694 | 5.04% | 13,763 | ||
| Pulaski | 2,922 | 21.66% | 9,876 | 73.22% | 690 | 5.12% | 13,488 | ||
| Putnam | 353 | 15.05% | 1,936 | 82.52% | 57 | 2.43% | 2,346 | ||
| Ralls | 1,138 | 21.61% | 3,969 | 75.37% | 159 | 3.02% | 5,266 | ||
| Randolph | 2,283 | 22.15% | 7,529 | 73.03% | 497 | 4.82% | 10,309 | ||
| Ray | 3,090 | 28.43% | 7,104 | 65.36% | 675 | 6.21% | 10,869 | ||
| Reynolds | 540 | 17.77% | 2,406 | 79.20% | 92 | 3.03% | 3,038 | ||
| Ripley | 830 | 15.03% | 4,522 | 81.86% | 172 | 3.11% | 5,524 | ||
| Saline | 2,789 | 30.07% | 5,977 | 64.45% | 508 | 5.48% | 9,274 | ||
| Schuyler | 354 | 18.29% | 1,505 | 77.74% | 77 | 3.98% | 1,936 | ||
| Scotland | 365 | 18.55% | 1,525 | 77.49% | 78 | 3.96% | 1,968 | ||
| Scott | 3,575 | 20.72% | 13,168 | 76.31% | 513 | 2.97% | 17,256 | ||
| Shannon | 776 | 19.88% | 2,966 | 75.97% | 162 | 4.15% | 3,904 | ||
| Shelby | 606 | 18.62% | 2,524 | 77.54% | 125 | 3.84% | 3,255 | ||
| St. Charles | 68,626 | 34.14% | 121,650 | 60.52% | 10,729 | 5.34% | 53,024 | 26.38% | 201,005 |
| St. Clair | 936 | 20.22% | 3,501 | 75.62% | 193 | 4.17% | 2,565 | 55.40% | 4,630 |
| St. Francois | 6,250 | 25.27% | 17,468 | 70.64% | 1,010 | 4.08% | 11,218 | 45.37% | 24,728 |
| St. Louis | 286,704 | 55.69% | 202,434 | 39.32% | 25,720 | 5.00% | -84,270 | -16.37% | 514,858 |
| St. Louis City | 104,235 | 79.45% | 20,832 | 15.88% | 6,124 | 4.67% | -83,403 | -63.57% | 131,191 |
| Ste. Genevieve | 2,542 | 30.02% | 5,496 | 64.90% | 431 | 5.09% | 2,954 | 34.88% | 8,469 |
| Stoddard | 1,876 | 14.11% | 11,079 | 83.36% | 336 | 2.53% | 9,203 | 69.24% | 13,291 |
| Stone | 2,887 | 17.43% | 13,158 | 79.42% | 522 | 3.15% | 10,271 | 62.00% | 16,567 |
| Sullivan | 526 | 21.16% | 1,884 | 75.78% | 76 | 3.06% | 1,358 | 54.63% | 2,486 |
| Taney | 4,373 | 18.60% | 18,276 | 77.72% | 866 | 3.68% | 13,903 | 59.12% | 23,515 |
| Texas | 1,728 | 15.77% | 8,875 | 81.01% | 353 | 3.22% | 7,147 | 65.23% | 10,956 |
| Vernon | 1,707 | 19.85% | 6,533 | 75.97% | 359 | 4.17% | 4,826 | 56.12% | 8,599 |
| Warren | 3,915 | 24.80% | 11,111 | 70.39% | 758 | 4.80% | 7,196 | 45.59% | 15,784 |
| Washington | 1,926 | 20.75% | 7,048 | 75.93% | 308 | 3.32% | 5,122 | 55.18% | 9,282 |
| Wayne | 948 | 16.45% | 4,658 | 80.84% | 156 | 2.71% | 3,710 | 64.39% | 5,762 |
| Webster | 3,177 | 18.98% | 12,840 | 76.69% | 726 | 4.34% | 9,663 | 57.71% | 16,743 |
| Worth | 195 | 18.64% | 808 | 77.25% | 43 | 4.11% | 613 | 58.60% | 1,046 |
| Wright | 1,170 | 14.41% | 6,707 | 82.61% | 242 | 2.98% | 5,537 | 68.20% | 8,119 |
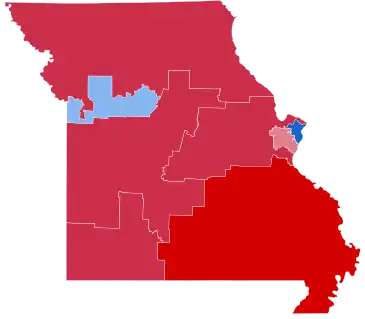
By congressional district
Trump won 6 of 8 congressional districts.[16]
| District | Trump | Clinton | Representative |
|---|---|---|---|
| 1st | 19% | 77% | Lacy Clay |
| 2nd | 53% | 42% | Ann Wagner |
| 3rd | 67% | 28% | Blaine Luetkemeyer |
| 4th | 65% | 29% | Vicky Hartzler |
| 5th | 40% | 55% | Emanuel Cleaver |
| 6th | 63% | 31% | Sam Graves |
| 7th | 70% | 25% | Billy Long |
| 8th | 75% | 21% | Jason Smith |
See also
References
- "Voter Turnout Report - State of Missouri General Election - 2016 General Election" (PDF). Missouri's Secretary of State.
- "Distribution of Electoral Votes". National Archives and Records Administration. 19 September 2019. Retrieved November 29, 2020.
- "Missouri Election Results 2016". The New York Times. Retrieved 2018-07-09.
- "Home". Archived from the original on 2016-01-31. Retrieved 2016-02-03.
- "State of Missouri - Election Night Results". Missouri Secretary of State. Government of Missouri. 16 March 2016. Archived from the original on 18 March 2016. Retrieved 16 March 2016.
- "RealClearPolitics - Election 2016 - Missouri: Trump vs. Clinton".
- "Our final map has Clinton winning with 352 electoral votes. Compare your picks with ours". Los Angeles Times. 2016-11-06. Retrieved 2016-11-13.
- Chalian, David (November 4, 2016). "Road to 270: CNN's new election map". CNN. Retrieved March 3, 2019.
- "2016 Electoral Scorecard". The Cook Political Report. November 7, 2016. Retrieved March 3, 2019.
- "2016 Electoral Map Prediction". Electoral-vote.com. November 8, 2016. Retrieved March 3, 2019.
- "Presidential Ratings". The Rothenberg Political Report. Retrieved August 16, 2021.
- Sabato, Larry J. (November 7, 2016). "2016 President". University of Virginia Center for Politics. Retrieved March 3, 2019.
- "2016 Election Maps - Battle for White House". RealClearPolitics. Retrieved 2016-11-13.
- "Electoral Scorecard: Map shifts again in Trump's favor, as Clinton holds edge". Fox News. 2016-11-07. Retrieved 2016-11-13.
- "2016 Presidential General Election Results - Missouri". uselectionatlas.org. Retrieved 2018-03-28.
- "Introducing the 2017 Cook Political Report Partisan Voter Index". The Cook Political Report.
External links
- RNC 2016 Republican Nominating Process Archived 2016-11-08 at the Wayback Machine
- Green papers for 2016 primaries, caucuses, and conventions
- Decision Desk Headquarter Results for Missouri