International rugby union team records
These are men's International Team records in international rugby,[1] updated at the conclusion of the November Internationals window each year.
To view men's individual records, see International rugby union player records. To view records of the men's Rugby World Cup, see Records and statistics of the Rugby World Cup.
| Top 20 as of 15 May 2023[2] | |||
|---|---|---|---|
| Rank | Change* | Team | Points |
| 1 | 91.82 | ||
| 2 | 90.47 | ||
| 3 | 88.98 | ||
| 4 | 88.97 | ||
| 5 | 82.77 | ||
| 6 | 82.12 | ||
| 7 | 81.80 | ||
| 8 | 80.72 | ||
| 9 | 78.08 | ||
| 10 | 77.39 | ||
| 11 | 76.23 | ||
| 12 | 76.03 | ||
| 13 | 74.84 | ||
| 14 | 74.63 | ||
| 15 | 71.21 | ||
| 16 | 67.62 | ||
| 17 | 66.24 | ||
| 18 | 65.92 | ||
| 19 | 65.85 | ||
| 20 | 64.05 | ||
| * Change from the previous week | |||
Team
World Rankings
Highest rankings
Below is a list of the best and worst ranking positions for all nations who have ever been ranked among the top ten, since the ranking tables were first published on the 13 October 2003:
| Team | Best | Worst | ||
|---|---|---|---|---|
| Rank | Year(s) | Rank | Year(s) | |
| 1 | 2003, 2004–07, 2008, 2009, 2009–19, 2019 |
5 | 2022 | |
| 1 | 2007–08, 2009, 2019, 2019–22 | 7 | 2017, 2018 | |
| 1 | 2003, 2003–04, 2019 | 8 | 2009, 2015–16 | |
| 1 | 2019, 2022–23 | 9 | 2013 | |
| 1 | 2019 | 10 | 2007, 2013, 2023 | |
| 1 | 2022 | 10 | 2018, 2019 | |
| 2 | 2003, 2004–05, 2007, 2008, 2010, 2011–12, 2015–16 |
8 | 2022 | |
| 3 | 2007–08 | 12 | 2014 | |
| 5 | 2017, 2017–18, 2018, 2023 | 12 | 2012, 2013, 2015 | |
| 7 | 2012–2013 | 17 | 2018, 2019 | |
| 7 | 2019 | 20 | 2003–2004, 2006 | |
| 8 | 2007 | 15 | 2015, 2017, 2018, 2019, 2020, 2021 | |
| 8 | 2018–2019 | 16 | 2011–2012 | |
| 9 | 2011–2012 | 20 | 2005–2006 | |
Most World Ranking points
Below is a list of the Top 10 most accumulated ranking points and corresponding fewest ranking points, since the ranking tables were first published on the 13 October 2003:
| Team | Most | Fewest | ||
|---|---|---|---|---|
| Rating Points | Date Achieved | Rating Points | Date Achieved | |
| 96.57 | 10 October 2016 | 85.79 | 29 August 2022 | |
| 94.49 | 23 August 2021 | 80.63 | 20 October 2003 | |
| 93.99 | 24 November 2003 | 77.79 | 17 September 2007 | |
| 91.82 | 13 March 2023 | 77.25 | 16 June 2008 | |
| 91.75 | 26 October 2015 | 80.64 | 14 November 2022 | |
| 90.47 | 13 March 2023 | 77.02 | 4 February 2019 | |
| 89.96 | 18 March 2019 | 74.17 | 1 October 2007 | |
| 87.45 | 22 October 2007 | 73.97 | 23 June 2014 | |
| 84.43 | 26 February 2018 | 72.91 | 14 November 2005 | |
| 82.08 | 14 October 2019 | 61.42 | 3 November 2003 | |
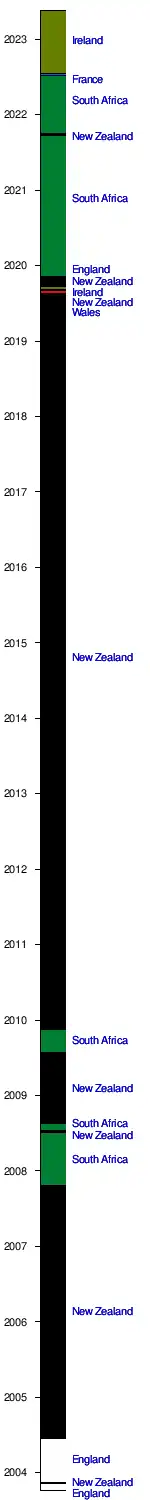
Longest tenure ranked at No. 1
England were ranked as No. 1 when the rankings were introduced in late 2003. New Zealand hold the record for the longest run as the No. 1 World Ranked team, spending just less than three months short of 10 years uninterrupted atop the rankings. Ireland currently top the world rankings. Not shown on the table, but the other nations to have been ranked No. 1, are Wales, spending two weeks in the top spot in 2019, before relinquishing the No. 1 spot to New Zealand, and France who held No. 1 for a week in 2022. Tenures are correct as of the last ranking update on 20 March 2023:
| Tenure | Team | Start | Matches | End | Last Match | Preceded By | Succeeded By |
|---|---|---|---|---|---|---|---|
| 3563d (9y9m3d) | 16 November 2009 | 128 | 19 August 2019 | 36–0 | |||
| 1225d (3y4m8d) | 14 June 2004 | 47 | 22 October 2007 | 18–20 | |||
| 658d (1y9m19d)12 | 04 November 2019 | 5 | 18 September 2021 | 17–30 | |||
| 343d (11m9d) | 18 August 2008 | 16 | 27 July 2009 | 19–28 | |||
| 304d (10m) | 18 July 2022 | 8 | 20 March 2023 | 29–16 | Ongoing | ||
| 280d (9m7d) | 4 October 2021 | 5 | 11 July 2022 | 12–13 | |||
| 259d (8m15d) | 22 October 2007 | 5 | 07 July 2008 | 8–19 | |||
| 210d (6m28d) | 17 November 2003 | 7 | 14 June 2004 | 3–36 |
Nations in bold indicate the tenure is ongoing.
- ^1 South Africa did not play any matches in the 2020 calendar year due to complications faced with preparation and travel as a result of the COVID-19 pandemic.
- ^2 Amongst South Africa's matches in their recent tenure at No. 1 are three matches against British & Irish Lions, which do not affect ranking points.
Key: y = years, m = months, d = days.
Most matches played ranked at No. 1
New Zealand hold the record for the most matches played whilst defending the No. 1 World Ranking, playing 128 matches during that time. Ireland currently top the world rankings. Not shown on the table, but the other nations to have been ranked No. 1, are Wales, spending two weeks in the top spot in 2019, before relinquishing the No. 1 spot to New Zealand, and France who held No. 1 for a week in 2022. Tenures are correct as of 18 March 2023:
| Matches | Team | Start | Tenure | End | Last Match | Preceded By | Succeeded By |
|---|---|---|---|---|---|---|---|
| 128 | 16 November 2009 | 3563d (9y9m3d) | 19 August 2019 | 36–0 | |||
| 47 | 14 June 2004 | 1225d (3y4m8d) | 22 October 2007 | 18–20 | |||
| 16 | 18 August 2008 | 343d (11m9d) | 27 July 2009 | 19–28 | |||
| 8 | 18 July 2022 | 243d (7m29d) | Ongoing | 29–16 | Ongoing | ||
| 7 | 17 November 2003 | 210d (6m28d) | 14 June 2004 | 3–36 | |||
| 6 | 27 July 2009 | 112d (3m20d) | 16 November 2009 | 13–20 |
Nations in bold indicate the tenure is ongoing.
Key: y = years, m = months, d = days.
Most matches
| Matches | Team | Debut | Wins | Lost | Drawn | % |
|---|---|---|---|---|---|---|
| 787 | 1906 | 427 | 323 | 33 | 54.26% | |
| 769 | 1871 | 430 | 288 | 51 | 55.92% | |
| 1881 | 399 | 340 | 29 | 51.89% | ||
| 730 | 1875 | 338 | 360 | 32 | 46.3% | |
| 726 | 1871 | 316 | 377 | 33 | 43.53% | |
| 664 | 1899 | 336 | 306 | 22 | 50.6% | |
| 615 | 1903 | 473 | 120 | 22 | 76.91% | |
| 520 | 1891 | 326 | 170 | 24 | 62.69% | |
| 519 | 1929 | 187 | 308 | 14 | 36.03% | |
| 466 | 1929 | 233 | 220 | 14 | 50% | |
| 457 | 1919 | 260 | 188 | 12 | 56.89% |
Nations in italics are classed as Tier 2 since the beginning of the professional era (Aug. 1995), and primarily play other Tier 2 nations.
Up to date as of 23 July 2022
Most wins
| Wins | Team | Debut | Matches | Lost | Drawn | % |
|---|---|---|---|---|---|---|
| 473 | 1903 | 615 | 120 | 22 | 76.91% | |
| 430 | 1871 | 769 | 288 | 51 | 55.92% | |
| 427 | 1906 | 787 | 323 | 33 | 54.26% | |
| 399 | 1881 | 769 | 340 | 29 | 51.89% | |
| 338 | 1875 | 730 | 360 | 32 | 46.3% | |
| 336 | 1899 | 664 | 306 | 22 | 50.6% | |
| 326 | 1891 | 509 | 170 | 24 | 62.69% | |
| 316 | 1871 | 726 | 377 | 33 | 43.53% | |
| 260 | 1919 | 457 | 188 | 12 | 56.89% | |
| 233 | 1929 | 466 | 220 | 14 | 50% |
Nations in italics are classed as Tier 2 since the beginning of the professional era (Aug. 1995), and primarily play other Tier 2 nations.
Up to date as of 23 July 2022
Most consecutive wins
| Wins | Team | First | Opp | Last | Opp | End | Score | Opp |
|---|---|---|---|---|---|---|---|---|
| 18 | 15 August 2015 | 22 October 2016 | 05 November 2016 | 29-40 | ||||
| 10 October 2015 | 11 March 2017 | 18 March 2017 | 9-13 | |||||
| 17 | 18 September 1965 | 14 June 1969 | 25 May 1970 | 6-17 | ||||
| 23 August 1997 | 28 November 1998 | 05 December 1998 | 7-13 | |||||
| 08 June 2013 | 21 June 2014 | 04 October 2014 | 25-27 | |||||
| 16 | 09 September 2011 | 06 October 2012 | 20 October 2012 | 18-18 | ||||
| 15 | 08 October 1994 | 02 July 1996 | 13 July 1996 | 16-21 | ||||
| 13 August 2005 | 26 August 2006 | 02 September 2006 | 20-21 | |||||
| 19 September 2009 | 11 September 2010 | 30 October 2010 | 24-26 | |||||
| 14 | 23 March 2002 | 23 August 2003 | 30 August 2003 | 16-17 | ||||
| 11 March 2018 | 16 March 2019 | 11 August 2019 | 19-33 | |||||
| 06 November 2021 | 05 February 2023 | 11 February 2023 | 19-32 |
In the professional era (Aug. 1995-), Teams that have played Tier 1 sides in 50% or more of their test matches in their winning run are eligible.
Most consecutive matches without loss
| Matches | Team | First | Opp | Draw | Score | Opp | End | Score | Opp |
|---|---|---|---|---|---|---|---|---|---|
| 23 | 22 May 1987 | 16 July 1988 | 19-19 | 18 August 1990 | 9-21 | ||||
| 22 | 08 June 2013 | 16 August 2014 | 12-12 | 04 October 2014 | 25-27 | ||||
| 20 | 09 September 2011 | 20 October 2012 | 18-18 | 01 December 2012 | 21-38 | ||||
| 18 | 15 August 2015 | N | N | N | 05 November 2016 | 29-40 | |||
| 10 October 2015 | N | N | N | 18 March 2017 | 9-13 | ||||
| 17 | 22 July 1961 | 25 August 1962/ 18 January 1964 | 9-9/ 0-0 | 29 August 1964 | 5-20 | ||||
| 18 September 1965 | N | N | N | 25 May 1970 | 6-17 | ||||
| 23 August 1997 | N | N | N | 05 December 1998 | 7-13 | ||||
| 16 | 06 August 1994 | 08 October 1994 | 18-18 | 13 July 1996 | 16-21 | ||||
| 15 | 13 August 1960 | 13 August 1960/ 18 February 1961/ 23 June 1962 | 11-11/ 0-0/ 3-3 | 10 August 1963 | 5-9 | ||||
| 13 August 2005 | N | N | N | 02 September 2006 | 20-21 | ||||
| 19 September 2009 | N | N | N | 30 October 2010 | 24-26 |
In the professional era (Aug. 1995-), teams that have played Tier 1 sides in 50% or more of their test matches in their winning run are eligible. An 'N' indicates the unbeaten run contained only wins, with no draws.
Most points
| Points | Team | Debut | Matches | Aga | Diff | PPM |
|---|---|---|---|---|---|---|
| 17416 | 1903 | 617 | 8340 | +9107 | 28.23 | |
| 14587 | 1906 | 787 | 12141 | +2456 | 18.54 | |
| 14100 | 1899 | 666 | 11982 | +2149 | 21.17 | |
| 13714 | 1871 | 769 | 9975 | +4526 | 17.83 | |
| 13626 | 1881 | 769 | 11963 | +1663 | 17.72 | |
| 13007 | 1910 | 469 | 9803 | +3204 | 27.73 | |
| 12268 | 1891 | 522 | 8486 | +3778 | 23.50 | |
| 11599 | 1875 | 730 | 10470 | +1129 | 15.89 | |
| 10622 | 1871 | 726 | 11153 | -531 | 14.63 | |
| 10226 | 1919 | 457 | 8266 | +1932 | 22.31 | |
| 10037 | 1930 | 366 | 10167 | +59 | 27.42 |
Nations in italics are classed as Tier 2 since the beginning of the professional era (Aug. 1995), and primarily play other Tier 2 nations.
Up to date as of 22 August 2022
Highest match attendance
| Attendance | Stadium | Country | Team 1 | Result | Team 2 | Date |
|---|---|---|---|---|---|---|
| 109874 | ANZ Stadium | Sydney, Australia | 35–39 | 15 Jul 2000[13] | ||
| 107042 | ANZ Stadium | Sydney, Australia | 28–7 | 28 Aug 1999[14] | ||
| 104000 | Murrayfield Stadium | Edinburgh, Scotland | 12–10 | 1 March 1975[15] | ||
| 95000 | Dinamo Stadion | Bucharest, Romania | 15–18 | 19 May 1957[16] | ||
| 94713 | National Stadium | Johannesburg, South Africa | 22–29 | 21 Aug 2010[17] | ||
| 90978 | ANZ Stadium | Sydney, Australia | 29–26 | 1 Sep 2001[18] | ||
| 90119 | Melbourne Cricket Ground | Melbourne, Australia | 18–33 | 26 Jul 1997[19] | ||
| 90000 | Ellis Park | Johannesburg, South Africa | 22–23 | 6 Aug 1955[20] | ||
| 89267 | Wembley Stadium | London, England | 44–10 | 27 Sep 2015[21] | ||
| 89019 | Wembley Stadium | London, England | 16–26 | 20 Sep 2015[22] |
RWC titles
| Team | Titles | Tournaments | % |
|---|---|---|---|
| 3 | 1995, 2007, 2019 | 33.33% | |
| 3 | 1987, 2011, 2015 | 33.33% | |
| 2 | 1991, 1999 | 22.22% | |
| 1 | 2003 | 11.11% |
RWC tournament points
| Points | Team | Tournament | Matches | Won | Lost | Draw | Diff | PPG |
|---|---|---|---|---|---|---|---|---|
| 361 | 2003 | 7 | 6 | 1 | 0 | +260 | 51.57 | |
| 345 | 2003 | 7 | 6 | 1 | 0 | +267 | 49.29 | |
| 327 | 1995 | 6 | 5 | 1 | 0 | +208 | 54.50 | |
| 2003 | 7 | 7 | 0 | 0 | +239 | 46.71 | ||
| 2007 | 5 | 4 | 1 | 0 | +272 | 65.40 | ||
| 301 | 2011 | 7 | 7 | 0 | 0 | +229 | 43.00 | |
| 298 | 1987 | 6 | 6 | 0 | 0 | +246 | 49.67 |
RWC tournament tries
| Tries | Team | Tournament | Matches | TPG |
|---|---|---|---|---|
| 52 | 2003 | 7 | 7.43 | |
| 48 | 2007 | 5 | 9.60 | |
| 43 | 1987 | 6 | 7.17 | |
| 2003 | 7 | 6.14 | ||
| 41 | 1995 | 6 | 6.83 | |
| 40 | 2011 | 7 | 5.71 |
RWC tournament conversions
| Conversions | Team | Tournament | Matches | CPG |
|---|---|---|---|---|
| 40 | 2003 | 7 | 5.71 | |
| 36 | 2007 | 5 | 7.20 | |
| 34 | 1995 | 6 | 5.67 | |
| 32 | 2003 | 7 | 4.57 | |
| 30 | 1987 | 6 | 5.00 |
RWC tournament penalties
| Penalties | Team | Tournament | Matches | PPG |
|---|---|---|---|---|
| 32 | 1999 | 5 | 6.40 | |
| 26 | 1995 | 6 | 4.33 | |
| 1999 | 5 | 5.20 | ||
| 25 | 1995 | 6 | 4.17 | |
| 2015 | 7 | 3.57 | ||
| 23 | 2003 | 7 | 3.29 | |
| 22 | 1999 | 6 | 3.67 | |
| 2003 | 7 | 3.14 |
RWC tournament drop goals
| Drop goals | Team | Tournament | Matches | DGPG |
|---|---|---|---|---|
| 8 | 1999 | 6 | 1.33 | |
| 2003 | 7 | 1.14 | ||
| 5 | 2007 | 7 | 0.71 | |
| 4 | 1991 | 3 | 1.33 | |
| 1995 | 6 | 0.67 | ||
| 1995 | 6 | 0.67 | ||
| 2003 | 7 | 0.57 | ||
| 2007 | 7 | 0.57 | ||
| 2011 | 4 | 1.00 |
RWC match margins
| Margin | Team | Opponent | Score | Date |
|---|---|---|---|---|
| 142 | 142–0 | 24 October 2003 | ||
| 128 | 145–17 | 4 June 1995 | ||
| 98 | 101–3 | 14 October 1999 | ||
| 111–13 | 2 November 2003 | |||
| 95 | 108–13 | 15 September 2007 |
RWC match points
| Points | Team | Opponent | Score | Date |
|---|---|---|---|---|
| 145 | 145–17 | 4 June 1995 | ||
| 142 | 142–0 | 24 October 2003 | ||
| 111 | 111–13 | 2 November 2003 | ||
| 108 | 108–13 | 15 September 2007 | ||
| 101 | 101–3 | 14 October 1999 | ||
| 101–10 | 15 October 1999 |
RWC match tries
| Tries | Team | Opponent | Score | Date |
|---|---|---|---|---|
| 22 | 142–0 | 24 October 2003 | ||
| 21 | 145–17 | 4 June 1995 | ||
| 17 | 111–13 | 2 November 2003 | ||
| 16 | 108–13 | 15 September 2007 | ||
| 14 | 101–3 | 14 October 1999 |
RWC match conversions
| Conversions | Team | Opponent | Score | Date |
|---|---|---|---|---|
| 20 | 145–17 | 4 June 1995 | ||
| 16 | 142–0 | 24 October 2003 | ||
| 14 | 108–13 | 15 September 2007 | ||
| 13 | 91–7 | 24 October 2003 | ||
| 111–13 | 2 November 2003 | |||
| 12 | 101–10 | 15 October 1999 | ||
| 87–0 | 22 September 2011 |
RWC match penalties
| Penalties | Team | Opponent | Score | Date |
|---|---|---|---|---|
| 8 | 41–5 | 30 May 1995 | ||
| 36–12 | 10 June 1995 | |||
| 32–16 | 10 October 1999 | |||
| 27–21 | 30 October 1999 | |||
| 7 | 33–12 | 16 October 1999 | ||
| 45–24 | 20 October 1999 | |||
| 28–24 | 20 October 1999 | |||
| 24–28 | 20 October 1999 | |||
| 21–44 | 24 October 1999 | |||
| 35–12 | 6 November 1999 | |||
| 33–10 | 9 October 2011 | |||
| 28–25 | 26 September 2015 |
RWC match drop goals
| Drop goals | Team | Opponent | Score | Date |
|---|---|---|---|---|
| 5 | 44–21 | 24 October 1999 | ||
| 3 | 15–17 | 12 October 1991 | ||
| 24–7 | 16 November 2003 | |||
| 30–15 | 30 September 2007 | |||
| 25–49 | 10 September 2011 |
Most wins
Teams that have played Tier 1 sides in 50% or more of their test matches in that year are eligible.
| Wins | Team | Year | Matches | Lost | Draw | % |
|---|---|---|---|---|---|---|
| 16 | 2003 | 17 | 1 | 0 | 94.11% | |
| 14 | 2007 | 17 | 3 | 0 | 82.35% | |
| 2013 | 14 | 0 | 0 | 100% | ||
| 13 | 2008 | 15 | 2 | 0 | 86.66% | |
| 2010 | 14 | 1 | 0 | 92.85% | ||
| 2016 | 14 | 1 | 0 | 92.85% | ||
| 2016 | 13 | 0 | 0 | 100% | ||
- New Zealand, England and France are the only three Tier 1 nations to complete a calendar year with a 100% win rate in the professional era (Aug. 1995-present).
Most points
Teams that have played Tier 1 sides in 50% or more of their test matches in that year are eligible.
| Points | Team | Year | Matches | Aga | Diff | PPG |
|---|---|---|---|---|---|---|
| 658 | 2007 | 17 | 257 | +401 | 38.71 | |
| 644 | 2003 | 17 | 201 | +443 | 37.88 | |
| 602 | 2003 | 14 | 201 | +395 | 43.00 | |
| 594 | 2007 | 12 | 148 | +446 | 49.50 | |
| 584 | 1995 | 12 | 205 | +379 | 48.67 |
Most tries
Teams that have played Tier 1 sides in 50% or more of their test matches in that year are eligible.
| Tries | Team | Year | Matches | TPG |
|---|---|---|---|---|
| 81 | 2003 | 14 | 5.79 | |
| 2007 | 17 | 4.76 | ||
| 80 | 2007 | 12 | 6.67 | |
| 2016 | 14 | 5.71 | ||
| 78 | 2018 | 14 | 5.57 | |
| 74 | 1997 | 13 | 5.69 | |
| 72 | 1997 | 12 | 6.00 | |
| 71 | 1995 | 12 | 5.91 | |
| 70 | 2001 | 11 | 6.36 | |
| 68 | 2003 | 17 | 4.00 |
Most conversions
Teams that have played Tier 1 sides in 50% or more of their test matches in that year are eligible.
| Conversions | Team | Year | Matches | CPG |
|---|---|---|---|---|
| 62 | 2007 | 17 | 3.65[37] | |
| 60 | 2016 | 14 | 4.29[38] | |
| 58 | 2003 | 14 | 4.14 | |
| 2007 | 12 | 4.83 | ||
| 57 | 2018 | 14 | 4.07 | |
| 54 | 1997 | 13 | 4.15 | |
| 53 | 1995 | 12 | 4.42 | |
| 1997 | 12 | 4.42 | ||
| 2003 | 17 | 3.12[39] | ||
| 2017 | 14 | 3.79 | ||
| 49 | 2019 | 11 | 4.45 | |
| 2019 | 15 | 3.27 |
Most penalties
Teams that have played Tier 1 sides in 50% or more of their test matches in that year are eligible.
| Penalties | Team | Year | Matches | PPG |
|---|---|---|---|---|
| 62 | 1999 | 14 | 4.43[40] | |
| 56 | 2009 | 14 | 4.00[41] | |
| 52 | 2012 | 15 | 3.47[42] | |
| 51 | 2003 | 17 | 3.00[43] | |
| 2003 | 18 | 2.83[44] | ||
| 49 | 2007 | 17 | 2.88 | |
| 48 | 1999 | 12 | 4.00 | |
| 2007 | 17 | 2.82 | ||
| 47 | 1995 | 12 | 3.62 | |
| 46 | 1994 | 13 | 3.54 | |
| 2010 | 14 | 3.29[45] |
Most drop goals
Teams that have played Tier 1 sides in 50% or more of their test matches in that year are eligible.
| Drop goals | Team | Year | Matches | DGPG |
|---|---|---|---|---|
| 15 | 2003 | 17 | 0.88[46] | |
| 11 | 1967 | 12 | 0.92[47] | |
| 9 | 1981 | 9 | 1.00 | |
| 2010 | 10 | 0.90[48] | ||
| 8 | 1958 | 8 | 1.00 | |
| 1968 | 12 | 0.67 | ||
| 1995 | 10 | 0.80[49] | ||
| 1999 | 13 | 0.62[50] | ||
| 2007 | 17 | 0.47 | ||
| 7 | 1960 | 9 | 0.78 | |
| 1961 | 11 | 0.64 | ||
| 1971 | 8 | 0.88[51] | ||
| 1979 | 8 | 0.88 | ||
| 1993 | 10 | 0.70 | ||
| 2003 | 18 | 0.39 |
Nations highlighted in italics are classed as Tier 2 in the professional era (Aug. 1995–present)
Matches
Team records within test matches.[52]
Most points
Test Matches that have included only Tier 1 Nations and/or Tier 2 Nations are eligible.
| Pnts | Team | Score | Opp | Tries | Con | Pen | Date |
|---|---|---|---|---|---|---|---|
| 145 | 145-17 | 21 | 20 | 0 | 04 June 1995 | ||
| 142 | 142-0 | 22 | 16 | 0 | 25 October 2003 | ||
| 134 | 134-0 | 20 | 14 | 2 | 17 November 2001 | ||
| 134-3 | 21 | 13 | 1 | 11 June 2005 | |||
| 111 | 111-13 | 17 | 13 | 0 | 02 November 2003 | ||
| 108 | 108-13 | 16 | 14 | 0 | 15 September 2007 | ||
| 106 | 106-8 | 16 | 13 | 0 | 21 August 1999 | ||
| 105 | 105-13 | 15 | 12 | 2 | 15 August 2007 |
Most tries
Test Matches that have included only Tier 1 Nations and/or Tier 2 Nations are eligible.
| Tries | Team | Score | Opp | Date |
|---|---|---|---|---|
| 22 | 142-0 | 25 October 2003 | ||
| 21 | 145-17 | 04 June 1995 | ||
| 134-3 | 11 June 2005 | |||
| 20 | 134-0 | 17 November 2001 | ||
| 17 | 111-13 | 02 November 2003 | ||
| 16 | 108-13 | 15 September 2007 | ||
| 106-8 | 21 August 1999 | |||
| 102-11 | 18 May 1994 | |||
| 102-0 | 03-07-2021 | |||
| 15 | 105-13 | 15 August 2007 | ||
| 101-14 | 03 September 2008 |
Most conversions
Test Matches that have included only Tier 1 Nations and/or Tier 2 Nations are eligible.
| Con | Team | Score | Opp | Date |
|---|---|---|---|---|
| 20 | 145-17 | 04 June 1995 | ||
| 16 | 142-0 | 25 October 2003 | ||
| 14 | 134-0 | 17 November 2001 | ||
| 108-13 | 15 September 2007 | |||
| 98-0 | 26 November 2004 | |||
| 13 | 134-3 | 11 June 2005 | ||
| 111-13 | 02 November 2003 | |||
| 106-8 | 21 August 1999 | |||
| 101-0 | 19 June 1999 | |||
| 101-14 | 03 September 2008 | |||
| 91-7 | 24 October 2003 |
Most penalties
Test Matches that have included only Tier 1 Nations and/or Tier 2 Nations are eligible.
| Con | Team | Score | Opp | Date |
|---|---|---|---|---|
| 9 | 44-17 | 08 May 1999 | ||
| 39-26 | 11 November 2000 | |||
| 34-15 | 24 July 1999 | |||
| 34-23 | 28 August 1999 | |||
| 32-30 | 08 February 2000 | |||
| 8 | 45-27 | 17 June 2006 | ||
| 41-5 | 30 May 1995 | |||
| 36-12 | 10 June 1995 | |||
| 32-16 | 10 October 1999 | |||
| 31-19 | 01 August 2009 |
- There are 18 Nations that have recorded 8 penalties in a Test Match. For the purpose of limiting the list to a reasonable size, the matches with the five highest scores by the team recording 8 penalties are shown here.
Most drop goals
Test Matches that have included only Tier 1 Nations and/or Tier 2 Nations are eligible.
| DG | Team | Score | Opp | Date |
|---|---|---|---|---|
| 5 | 44-21 | 24 October 1999 | ||
| 4 | 25-14 | 25 November 2006 | ||
| 18-13 | 22 November 2014 | |||
| 3 | 52-28 | 10 August 1985 | ||
| 45-10 | 27 November 2004 | |||
| 38-13 | 07 April 2002 | |||
| 34-20 | 05 February 2000 | |||
| 30-15 | 21 September 1975 | |||
| 30-15 | 30 September 2007 | |||
| 29-21 | 07 October 1990 |
- There are 37 instances that Nations have recorded 3 drop goals in a Test Match. For the purpose of limiting the list to a reasonable size, the matches with the seven highest scores by the team recording 3 drop goals are shown here.
Most aggregate points
Test Matches that have included only Tier 1 Nations and/or Tier 2 Nations are eligible.
| Pnts | Team 1 | Score | Team 2 | Tries | Con | Pen | DG | Date |
|---|---|---|---|---|---|---|---|---|
| 162 | 145-17 | 23 | 22 | 1 | 0 | 04 June 1995 | ||
| 142 | 142-0 | 22 | 16 | 0 | 0 | 25 October 2003 | ||
| 137 | 134-3 | 21 | 13 | 2 | 0 | 11 June 2005 | ||
| 134 | 134-0 | 20 | 14 | 2 | 0 | 17 November 2001 | ||
| 124 | 111-13 | 18 | 14 | 2 | 0 | 02 November 2003 | ||
| 121 | 108-13 | 17 | 15 | 1 | 1 | 15 September 2007 | ||
| 118 | 105-13 | 16 | 13 | 4 | 0 | 15 August 2007 | ||
| 115 | 101-14 | 17 | 15 | 0 | 0 | 03 September 2008 | ||
| 114 | 106-8 | 17 | 13 | 1 | 0 | 21 August 1999 | ||
| 113 | 102-11 | 17 | 11 | 2 | 0 | 18 May 1994 |
Most aggregate tries
Test Matches that have included only Tier 1 Nations and/or Tier 2 Nations are eligible.
| Tries | Team 1 | T1 Try | Score | T2 Try | Team 2 | Date |
|---|---|---|---|---|---|---|
| 23 | 21 | 145-17 | 2 | 04 June 1995 | ||
| 22 | 22 | 142-0 | 0 | 25 October 2003 | ||
| 21 | 21 | 134-3 | 0 | 11 June 2005 | ||
| 20 | 20 | 134-0 | 0 | 17 November 2001 | ||
| 18 | 17 | 111-13 | 1 | 02 November 2003 | ||
| 17 | 16 | 108-13 | 1 | 15 September 2007 | ||
| 16 | 106-8 | 1 | 21 August 1999 | |||
| 16 | 102-11 | 1 | 18 May 1994 | |||
| 15 | 105-13 | 2 | 15 August 2007 | |||
| 15 | 101-14 | 2 | 03 September 2008 |
Most aggregate conversions
Test Matches that have included only Tier 1 Nations and/or Tier 2 Nations are eligible.
| Con | Team 1 | T1 Con | Score | T2 Con | Team 2 | Date |
|---|---|---|---|---|---|---|
| 22 | 20 | 145-17 | 2 | 04 June 1995 | ||
| 16 | 16 | 142-0 | 0 | 25 October 2003 | ||
| 15 | 14 | 108-13 | 1 | 15 September 2007 | ||
| 13 | 101-14 | 2 | 03 September 2008 | |||
| 14 | 14 | 134-0 | 0 | 17 November 2001 | ||
| 14 | 98-0 | 0 | 26 November 2004 | |||
| 13 | 111-13 | 1 | 02 November 2003 | |||
| 13 | 91-7 | 1 | 24 October 2003 | |||
| 13 | 13 | 134-3 | 0 | 11 June 2005 | ||
| 13 | 101-0 | 0 | 19 June 1999 | |||
| 12 | 106-8 | 1 | 21 August 1999 | |||
| 12 | 105-13 | 1 | 15 August 2007 | |||
| 12 | 101-10 | 1 | 15 October 1999 | |||
| 12 | 91-10 | 1 | 01 November 2001 | |||
| 9 | 66-23 | 4 | 12 June 2010 |
Most aggregate penalties
Test Matches that have included only Tier 1 Nations and/or Tier 2 Nations are eligible.
| Pen | Team 1 | T1 Pen | Score | T2 Pen | Team 2 | Date |
|---|---|---|---|---|---|---|
| 14 | 8 | 27-21 | 6 | 30 October 1999 | ||
| 7 | 54-28 | 7 | 22 August 1998 | |||
| 7 | 28-24 | 7 | 20 October 1999 | |||
| 13 | 9 | 39-26 | 4 | 11 November 2000 | ||
| 8 | 29-18 | 5 | 26 June 2013 | |||
| 8 | 27-22 | 5 | 24 June 2000 | |||
| 7 | 38-37 | 6 | 17 November 2012 | |||
| 7 | 35-21 | 6 | 11 June 2005 | |||
| 7 | 28-18 | 6 | 09 March 2013 | |||
| 12 | 9 | 34-23 | 3 | 28 August 1999 | ||
| 7 | 28-25 | 5 | 26 September 2015 | |||
| 7 | 21–44 | 5 | 24 October 1999 | |||
| 6 | 32-21 | 6 | 16 November 2002 | |||
| 6 | 32-23 | 6 | 16 June 2001 |
- There are 14 instances where 12 penalties have been recorded in a Test Match. For the purpose of limiting the list to a reasonable size, the five highest total-scoring matches are shown here.
Most aggregate drop goals
Test Matches that have included only Tier 1 Nations and/or Tier 2 Nations are eligible.
| DG | Team 1 | T1 DG | Score | T2 DG | Team 2 | Date |
|---|---|---|---|---|---|---|
| 6 | 3 | 18-9 | 3 | 28 June 1986 | ||
| 5 | 5 | 44-21 | 0 | 24 October 1999 | ||
| 4 | 4 | 25-14 | 0 | 25 November 2006 | ||
| 4 | 18-13 | 0 | 22 November 2014 | |||
| 3 | 34-20 | 1 | 05 February 2000 | |||
| 3 | 29-21 | 1 | 07 October 1990 | |||
| 3 | 28-19 | 1 | 30 June 1990 | |||
| 3 | 15-9 | 1 | 19 January 1991 | |||
| 2 | 15-15 | 2 | 13 November 1983 | |||
| 2 | 15-12 | 2 | 20 January 1996 | |||
- There are 12 instances where 4 drop goals have been recorded in a Test Match. For the purpose of limiting the list to a reasonable size, the eight highest total scoring matches are shown here.
See also
References
- "Rugby Test Records". ESPN. 26 September 2015. Retrieved 30 March 2020.
- "Men's World Rankings". World Rugby. Retrieved 15 May 2023.
- "World Rugby Matches". ESPN. 26 September 2015. Archived from the original on 1 April 2016. Retrieved 15 July 2020.
- "World Rugby Rankings". world.rugby. 26 September 2015. Archived from the original on 18 August 2019. Retrieved 30 March 2020.
- "World Rugby Matches". ESPN. 26 September 2015. Archived from the original on 1 April 2016. Retrieved 15 July 2020.
- "World Rugby Rankings". world.rugby. 26 September 2015. Archived from the original on 18 August 2019. Retrieved 30 March 2020.
- "Most team matches". ESPN. 26 September 2015. Archived from the original on 28 September 2015. Retrieved 27 March 2020.
- "Most team wins". ESPN. 26 September 2015. Archived from the original on 28 September 2015. Retrieved 27 March 2020.
- "Most consecutive wins". ESPN. 26 September 2015. Archived from the original on 8 November 2020. Retrieved 27 March 2020.
- "Most consecutive matches without defeat". ESPN. 26 September 2015. Archived from the original on 9 August 2016. Retrieved 27 March 2020.
- "Most team points". ESPN. 26 September 2015. Archived from the original on 28 September 2015. Retrieved 27 March 2020.
- "Highest Match Attendance". ESPN. 26 September 2015. Archived from the original on 20 November 2018. Retrieved 29 March 2020.
- "Lomu clinches Tri-ations epic". bbc.co.uk. 15 July 2000. Retrieved 30 March 2020.
- "Australia v New Zealand: a fierce rugby rivalry – in pictures". theguardian.com. 29 October 2015. Retrieved 30 March 2020.
- "Archive: Record crowd at Murrayfield". bbc.com. 20 February 2015. Retrieved 30 March 2020.
- "Red & Yellow cards, Romania's record, Test status and Tri-Nations tours to France". Espn.co.uk. 1 Aug 2011. Retrieved 28 March 2020.
- "THE RUGBY CHAMPIONSHIP ROUND SIX PREVIEW - SOUTH AFRICA VERSUS NEW ZEALAND". super.rugby. 5 Oct 2012. Retrieved 30 March 2020.
- "All Blacks v Wallabies: Five great Sydney clashes". nz herald. 17 Aug 2012. Retrieved 30 March 2020.
- "Rugby union". mcg.org.au. 30 June 2007. Retrieved 30 March 2020.
- "1955 British & Irish Lions Tour of South Africa". world.rugby. 26 September 2015. Retrieved 30 March 2020.
- "Ireland continue 100% record with Romania rout". Espn.co.uk. 27 September 2015. Retrieved 30 March 2020.
- "Richie McCaw sin-binned as NZ labour to victory". telegraph.co.uk. 20 September 2015. Retrieved 30 March 2020.
- "Most team points in a tournament". ESPN. 26 September 2015.
{{cite web}}: CS1 maint: url-status (link) - "Most team tries in a tournament". ESPN. 26 September 2015.
{{cite web}}: CS1 maint: url-status (link) - "Most team conversions in a tournament". ESPN. 26 September 2015.
{{cite web}}: CS1 maint: url-status (link) - "Most team penalties in a tournament". ESPN. 26 September 2015.
{{cite web}}: CS1 maint: url-status (link) - "Most team drop goals in a tournament". ESPN. 26 September 2015.
{{cite web}}: CS1 maint: url-status (link) - "All Time RWC Team Records". Rugbyworldcup.com. 26 September 2015. Archived from the original on 27 September 2015. Retrieved 26 September 2015.
- "Most team points in a rwc match". ESPN. 26 September 2015. Archived from the original on 6 March 2016. Retrieved 27 March 2020.
- "Most team tries in a rwc match". ESPN. 26 September 2015. Archived from the original on 28 September 2015. Retrieved 27 March 2020.
- "Most team conversions in a rwc match". ESPN. 26 September 2015.
{{cite web}}: CS1 maint: url-status (link) - "Most team penalties in a rwc match". ESPN. 26 September 2015.
{{cite web}}: CS1 maint: url-status (link) - "Most team drop goals in a rwc match". Espnscrum.com. 26 September 2015. Retrieved 30 April 2020.
- "Most team wins in a calendar year". ESPNscrum.com. 26 September 2015. Retrieved 27 March 2020.
- "Most team points in a calendar year". ESPNscrum.com. 26 September 2015. Retrieved 27 March 2020.
- "Most team tries in a calendar year". ESPNscrum.com. 26 September 2015. Retrieved 27 March 2020.
- "Most South Africa team conversions in a calendar year". ESPNscrum.com. 26 September 2015. Retrieved 30 April 2020.
- "Most New Zealand team conversions in a calendar year". ESPNscrum.com. 26 September 2015. Retrieved 30 April 2020.
- "Most England team conversions in a calendar year". ESPNscrum.com. 26 September 2015. Retrieved 30 April 2020.
- "Most Wales team penalties in a calendar year". ESPNscrum.com. 26 September 2015. Retrieved 30 April 2020.
- "Most New Zealand team penalties in a calendar year". ESPNscrum.com. 26 September 2015. Retrieved 30 April 2020.
- "Most Australia team penalties in a calendar year". ESPNscrum.com. 26 September 2015. Retrieved 30 April 2020.
- "Most England team penalties in a calendar year". ESPNscrum.com. 26 September 2015. Retrieved 30 April 2020.
- "Most France team penalties in a calendar year". ESPNscrum.com. 26 September 2015. Retrieved 30 April 2020.
- "Most Wales team penalties in a calendar year". ESPNscrum.com. 26 September 2015. Retrieved 30 April 2020.
- "Most England drop goals in a calendar year". ESPNscrum.com. 26 September 2015. Retrieved 30 April 2020.
- "Most France drop goals in a calendar year". ESPNscrum.com. 26 September 2015. Retrieved 30 April 2020.
- "Most Scotland drop goals in a calendar year". ESPNscrum.com. 26 September 2015. Retrieved 30 April 2020.
- "Most Romania drop goals in a calendar year". ESPNscrum.com. 26 September 2015. Retrieved 30 April 2020.
- "Most South Africa drop goals in a calendar year". ESPNscrum.com. 26 September 2015. Retrieved 30 April 2020.
- "Most Argentina drop goals in a calendar year". ESPNscrum.com. 26 September 2015. Retrieved 30 April 2020.
- "Rugby Test Matches Archive". ESPNscrum.com. 26 September 2015. Retrieved 30 March 2020.
- "Most team points in a match". ESPNscrum.com. 26 September 2015. Retrieved 30 March 2020.
- "Most team tries in a match". ESPNscrum.com. 26 September 2015. Retrieved 30 March 2020.
- "Most team conversions in a match". ESPNscrum.com. 26 September 2015. Retrieved 30 March 2020.
- "Most team penaltiess in a match". ESPNscrum.com. 26 September 2015. Retrieved 30 March 2020.
- "Most team drop goals in a match". ESPNscrum.com. 26 September 2015. Retrieved 30 March 2020.
- "Most Total points in a match". ESPNscrum.com. 26 September 2015. Retrieved 30 March 2020.
- "Most total team tries in a match". ESPNscrum.com. 26 September 2015. Retrieved 30 March 2020.
- "Most total team conversions in a match". ESPNscrum.com. 26 September 2015. Retrieved 30 March 2020.
- "Most total team penalties in a match". ESPNscrum.com. 26 September 2015. Retrieved 30 March 2020.
- "Most total team drop goals in a match". ESPNscrum.com. 26 September 2015. Retrieved 30 March 2020.